
Page 197 - AJWEP-v22i2
P. 197
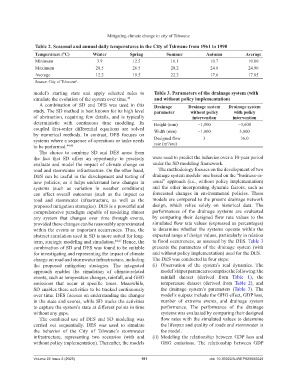
Mitigating climate change in city of Tshwane

                 Table 2. Seasonal and annual daily temperatures in the City of Tshwane from 1961 to 1990
                 Temperature (°C)         Winter          Spring          Summer            Autumn           Average
                 Minimum                    3.9            12.5             16.1              10.7            10.80
                 Maximum                   20.5            26.5             28.2              24.6            24.90
                 Average                   12.2            19.5             22.2              17.6            17.85
                 Source: City of Tshwane . 2
                model’s starting state and apply selected  rules to   Table 3. Parameters of the drainage system (with
                simulate the evolution of the system over time. 45   and without policy implementation)
                  A combination of SD and DES was used in this       Drainage       Drainage system   Drainage system
                study. The SD method is best known for its high level   parameter    without policy     with policy
                of abstraction,  requiring  few details,  and is typically            intervention     intervention
                deterministic  with continuous time  modeling.  Its   Height (mm)       −1,800            −3,600
                coupled  first-order  differential  equations  are  solved   Width (mm)  −1,800           3,800
                by numerical methods. In contrast, DES focuses on
                systems where a sequence of operations or tasks needs   Designed flow     3                36.0
                                                                           3
                to be performed. 44,45                               rate (m /sec)
                  The choice to combine SD  and DES arose from
                the  fact  that  SD  offers  an  opportunity  to  precisely   were used to predict the behavior over a 10-year period
                evaluate  and model the impact  of climate  change on   under the SD modeling framework.
                road and stormwater infrastructure. On the other hand,   The methodology focuses on the development of two
                DES can be useful in the development and testing of   drainage system models: one based on the “business-as-
                new policies,  as it helps understand how changes in   usual” approach (i.e., without policy implementation)
                systems (such as variation  in weather conditions)   and the other incorporating  dynamic factors, such as
                can  affect  overall  outcomes  (such  as  the  impact  on   forecasted  changes in  environmental  policies.  These
                road and stormwater  infrastructure,  as well as the   models are compared to the present drainage network
                proposed mitigation strategies). DES is a powerful and   design, which relies solely on historical  data.  The
                comprehensive  paradigm capable of modeling almost   performances of the drainage systems are evaluated
                any system that changes over time  through events,   by  comparing  their  designed  flow  rate  values  to  the
                provided these changes can be reasonably approximated   simulated flow rate values (expressed as percentages)
                within the events or important occurrences.  Thus, the   to determine  whether  the systems operate  within the
                abstract simulation used in SD is more suited for long-  expected range of design values, particularly in relation
                term, strategic modeling and simulation. 44,45  Hence, the   to flood occurrences, as assessed by the DES. Table 3
                combination of SD and DES was found to be suitable   presents the parameters of the drainage system (with
                for investigating and representing the impact of climate   and without policy implementation) used for the DES.
                change on road and stormwater infrastructure, including   The DES was conducted in four steps:
                the proposed mitigation  strategies.  The integrated   (i)  Observation of the system’s real  dynamics.  The
                approach  enables  the simulation  of climate-related   model’s input parameters comprise the following: the
                events, such as temperature changes, rainfall, and GHG   rainfall dataset (derived from  Table  1), the
                emissions  that  occur  at  specific  times.  Meanwhile,   temperature  dataset  (derived  from  Table  2), and
                SD enables these activities to be tracked continuously   the drainage  system’s parameters  (Table  3). The
                over time. DES focuses on understanding the changes     model’s outputs include the GHG effect, GDP loss,
                in the state and events, while SD tracks the activities   number of extreme  events, and drainage  system
                to capture the system’s state at different points in time   performance.  The performance  of the drainage
                without any gaps.                                       systems was evaluated by comparing their designed
                  The  combined  use of DES and  SD modeling  was       flow rates with the simulated values to determine
                carried  out  sequentially.  DES was used  to  simulate   the lifespan and quality of roads and stormwater in
                the behavior of the City of  Tshwane’s stormwater       the model.
                infrastructure, representing two scenarios (with and   (ii)  Modeling the relationship between GDP loss and
                without policy implementation). Thereafter, the models   GHG  emissions.  The relationship between GDP


                Volume 22 Issue 2 (2025)                       191                           doi: 10.36922/AJWEP025080049