
Page 194 - AJWEP-v22i2
P. 194
Sefolo, et al.
are constructed at the end of the stormwater pipeline
to prevent erosion. The climate change policy proposes
GDP an increase in the capacity of the drainage system,
with pipe sizes ranging from 2,100 mm in height by
Amount of Extreme 3,800 mm in width to 3,600 mm by 3,800 mm, and a
3
rainfall events flow rate of 36.0 m /s. The city falls within the summer
rainfall region of eastern South Africa, receiving an
Climate annual average rainfall of 670 mm. 37
change Figure 3 depicts maps of South Africa, Gauteng
province, and the City of Tshwane.
Green
Temperature
house effect
2.4. Description of the datasets
Data were collected from the records of the City of
Infrastructural
37
2
performance Tshwane, the SAWS, and from grey literature.
Historical data may omit important factors, which
can lead to inaccurate analysis and forecasts. Moreover,
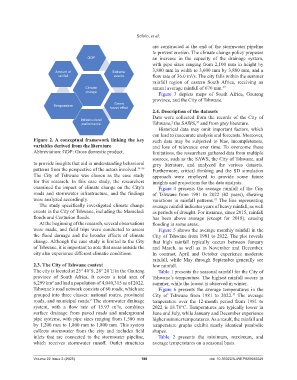
Figure 2. A conceptual framework linking the key such data may be subjected to bias, incompleteness,
variables derived from the literature and loss of relevance over time. To overcome these
Abbreviation: GDP: Gross domestic product. limitations, the researchers gathered data from multiple
sources, such as the SAWS, the City of Tshwane, and
to provide insights that aid in understanding behavioral grey literature, and analyzed the various datasets.
patterns from the perspective of the actors involved. 34-36 Furthermore, critical thinking and the SD simulation
The City of Tshwane was chosen as the case study approach were employed to provide some future
for this research. In this case study, the researchers insights and projections for the data analysis.
examined the impact of climate change on the City’s Figure 4 presents the average rainfall of the City
roads and stormwater infrastructure, and the findings of Tshwane from 1981 to 2022 (42 years), showing
were analyzed accordingly. variations in rainfall patterns. The line representing
37
The study specifically investigated climate change average rainfall indicates years of heavy rainfall, as well
events in the City of Tshwane, including the Mamelodi as periods of drought. For instance, since 2015, rainfall
floods and Centurion floods. has been above average (except for 2018), causing
At the beginning of the research, several observations flooding in some areas.
were made, and field trips were conducted to assess Figure 5 shows the average monthly rainfall in the
the flood damage and the broader effects of climate City of Tshwane from 1981 to 2022. The plot reveals
change. Although the case study is limited to the City that high rainfall typically occurs between January
of Tshwane, it is important to note that areas outside the and March, as well as in November and December.
city also experience different climatic conditions. In contrast, April and October experience moderate
rainfall, while May through September generally see
2.3. The City of Tshwane context low rainfall.
The city is located at 25° 40’S, 28° 20’E in the Gauteng Table 1 presents the seasonal rainfall for the City of
province of South Africa. It covers a total area of Tshwane’s temperature. The highest rainfall occurs in
6,299 km and had a population of 4,040,315 as of 2022. summer, while the lowest is observed in winter.
2
Tshwane’s road network consists of 60 roads, which are Figure 6 presents the average temperatures in the
grouped into three classes: national routes, provincial City of Tshwane from 1981 to 2022. The average
37
roads, and municipal roads. The stormwater drainage temperature over the 12-month period from 1981 to
2
system, with a flow rate of 15.93 m /s, combines 2022 is 18.78°C. Temperatures are typically lower in
3
surface drainage from paved roads and underground June and July, while January and December experience
pipe systems, with pipe sizes ranging from 1,500 mm higher summer temperatures. As a result, the rainfall and
by 1,200 mm to 1,800 mm to 1,800 mm. This system temperature graphs exhibit nearly identical parabolic
collects stormwater from the city and includes field shapes.
inlets that are connected to the stormwater pipeline, Table 2 presents the minimum, maximum, and
which receives stormwater runoff. Outlet structures average temperatures on a seasonal basis.
Volume 22 Issue 2 (2025) 188 doi: 10.36922/AJWEP025080049