
Page 195 - AJWEP-v22i2
P. 195
Mitigating climate change in city of Tshwane
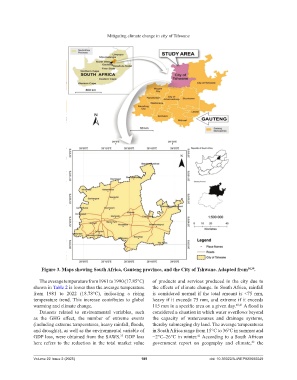
Figure 3. Maps showing South Africa, Gauteng province, and the City of Tshwane. Adapted from 38,39 .
The average temperature from 1961 to 1990 (17.85°C) of products and services produced in the city due to
shown in Table 2 is lower than the average temperature the effects of climate change. In South Africa, rainfall
from 1981 to 2022 (18.78°C), indicating a rising is considered normal if the total amount is <75 mm,
temperature trend. This increase contributes to global heavy if it exceeds 75 mm, and extreme if it exceeds
warming and climate change. 115 mm in a specific area on a given day. 40,41 A flood is
Datasets related to environmental variables, such considered a situation in which water overflows beyond
as the GHG effect, the number of extreme events the capacity of watercourses and drainage systems,
(including extreme temperatures, heavy rainfall, floods, thereby submerging dry land. The average temperatures
and droughts), as well as the environmental variable of in South Africa range from 15°C to 36°C in summer and
GDP loss, were obtained from the SAWS. GDP loss −2°C–26°C in winter. According to a South African
37
41
here refers to the reduction in the total market value government report on geography and climate, the
42
Volume 22 Issue 2 (2025) 189 doi: 10.36922/AJWEP025080049