
Page 103 - AJWEP-v22i3
P. 103
Advancing molecular property prediction using graph neural networks
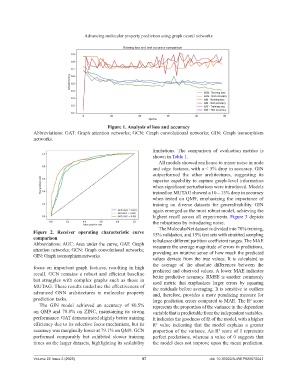
Figure 1. Analysis of loss and accuracy
Abbreviations: GAT: Graph attention networks; GCN: Graph convolutional networks; GIN: Graph isomorphism
networks.
limitations. The comparison of evaluation metrics is
shown in Table 1.
All models showed resilience to minor noise in node
and edge features, with a < 5% drop in accuracy. GIN
outperformed the other architectures, suggesting its
superior capability to capture graph-level information
when significant perturbations were introduced. Models
trained on MUTAG showed a 10 – 15% drop in accuracy
when tested on QM9, emphasizing the importance of
training on diverse datasets for generalizability. GIN
again emerged as the most robust model, achieving the
highest recall across all experiments. Figure 3 depicts
the robustness by introducing noise.
The MolecularNet dataset is divided into 70% training,
Figure 2. Receiver operating characteristic curve 15% validation, and 15% test sets with stratified sampling
comparison to balance different partition coefficient ranges. The MAE
Abbreviations: AUC: Area under the curve; GAT: Graph measures the average magnitude of errors in predictions,
attention networks; GCN: Graph convolutional networks;
GIN: Graph isomorphism networks. providing an intuitive sense of how much the predicted
values deviate from the true values. It is calculated as
the average of the absolute differences between the
focus on important graph features, resulting in high predicted and observed values. A lower MAE indicates
recall. GCN remains a robust and efficient baseline better predictive accuracy. RMSE is another commonly
but struggles with complex graphs such as those in used metric that emphasizes larger errors by squaring
MUTAG. These results underline the effectiveness of the residuals before averaging. It is sensitive to outliers
advanced GNN architectures in molecular property and, therefore, provides a more penalizing measure for
prediction tasks. large prediction errors compared to MAE. The R score
2
The GIN model achieved an accuracy of 80.5% represents the proportion of the variance in the dependent
on QM9 and 78.8% on ZINC, maintaining its strong variable that is predictable from the independent variables.
performance. GAT demonstrated slightly better training It indicates the goodness of fit of the model, with a higher
efficiency due to its selective focus mechanism, but its R value indicating that the model explains a greater
2
accuracy was marginally lower at 79.1% on QM9. GCN proportion of the variance. An R score of 1 represents
2
performed comparably but exhibited slower training perfect predictions, whereas a value of 0 suggests that
times on the larger datasets, highlighting its scalability the model does not improve upon the mean prediction.
Volume 22 Issue 3 (2025) 97 doi: 10.36922/AJWEP025070041