
Page 105 - AJWEP-v22i3
P. 105
Advancing molecular property prediction using graph neural networks
aggregation method, based on summation, facilitates graph features, achieving high recall and precision in
strong feature representation that corresponds with the graph classification tasks. 18
results from Xu et al. (2019), where GIN was noted for The findings highlight the adaptability of GNNs
5
its ability to differentiate graph architectures effectively. for molecular property prediction tasks, with each
GAT attained strong results with elevated recall (0.89) architecture excelling in specific aspects such as GIN
and ROC-AUC (0.83). Its capacity to allocate attention for structural differentiation, GAT for noisy or complex
weights to significant neighbors enhances its resilience graphs, and GCN for computational efficiency. This
in noisy graphs. This aligns with Veličković et al., study underscores the importance of tailoring GNN
18
who illustrated the usefulness of attention in complex architectures to dataset characteristics. For small
graphs, exhibiting dependable yet slightly lower datasets such as MUTAG, simpler architectures such
performance with an accuracy of 87.50%. Its failure as GIN perform exceptionally well, whereas attention-
to adequately distinguish subtle graph structures in based models such as GAT may excel in larger, noisier
MUTAG corresponds with previous research by Kipf datasets. This comparative analysis places our findings
and Welling that pinpointed GCN shortcomings in in the broader context of molecular property prediction
intricate graph situations. 4 research, demonstrating the strengths and trade-offs of
The MUTAG dataset consists of small molecular various GNN architectures.
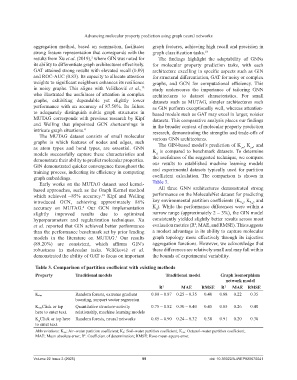
graphs in which features of nodes and edges, such The GIN-based model’s prediction of K , K , and
as atom types and bond types, are essential. GNN ₒw ₐw
models successfully capture these characteristics and K is compared to benchmark datasets. To determine
d
demonstrate their ability to predict molecular properties. the usefulness of the suggested technique, we compare
GIN demonstrated quicker convergence throughout the our results to established machine learning models
training process, indicating its efficiency in computing and experimental datasets typically used for partition
graph embeddings. coefficient calculation. The comparison is shown in
Early works on the MUTAG dataset used kernel- Table 3.
based approaches, such as the Graph Kernel method All three GNN architectures demonstrated strong
which achieved ~85% accuracy. Kipf and Welling performance on the MoleculeNet dataset for predicting
18
introduced GCN, achieving approximately 86% key environmental partition coefficients (Kₒ , Kₐ , and
w
w
accuracy on MUTAG. Our GCN implementation K ). While the performance differences were within a
4
d
slightly improved results due to optimized narrow range (approximately 2 – 3%), the GIN model
hyperparameters and regularization techniques. Xu consistently yielded slightly better results across most
2
et al. reported that GIN achieved better performance evaluation metrics (R , MAE, and RMSE). This suggests
than the performance benchmark set by prior leading a modest advantage in its ability to capture molecular
models in the literature on MUTAG. Our results graph topology more effectively through its injective
5
(89.20%) are consistent, which affirms GIN’s aggregation functions. However, we acknowledge that
robustness in molecular tasks. Veličković et al. these differences are relatively small and may fall within
demonstrated the ability of GAT to focus on important the bounds of experimental variability.
Table 3. Comparison of partition coefficient with existing methods
Property Traditional models Traditional model Graph isomorphism
network model
R 2 MAE RMSE R 2 MAE RMSE
Random forests, extreme gradient 0.80 – 0.87 0.25 – 0.35 0.40 0.88 0.22 0.35
Kₒ w
boosting, support vector regression
Kₐ wClick or tap Quantitative structure-activity 0.75 – 0.82 0.30 – 0.40 0.45 0.85 0.26 0.40
here to enter text. relationship, machine learning models
K Click or tap here Random forests, neural networks 0.85 – 0.90 0.24 – 0.32 0.38 0.91 0.20 0.30
d
to enter text.
Abbreviations: K aw: Air–water partition coefficient; K d: Soil–water partition coefficient; K ow: Octanol–water partition coefficient;
MAE: Mean absolute error; R : Coefficient of determination; RMSE: Root-mean-square error.
2
Volume 22 Issue 3 (2025) 99 doi: 10.36922/AJWEP025070041