
Page 154 - AJWEP-v22i3
P. 154
Sow and Gaye
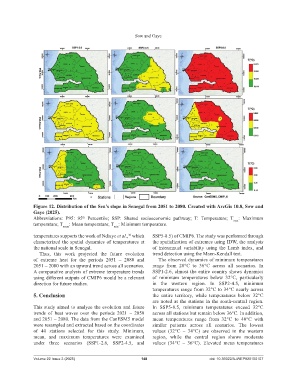
Figure 12. Distribution of the Sen’s slope in Senegal from 2051 to 2080. Created with ArcGis 10.8, Sow and
Gaye (2025).
Abbreviations: P95: 95 Percentile; SSP: Shared socioeconomic pathway; T: Temperature; T max : Maximum
th
temperature; T : Mean temperature; T : Minimum temperature.
mean min
temperatures supports the work of Ndiaye et al., which SSP5-8.5) of CMIP6. The study was performed through
30
characterized the spatial dynamics of temperatures at the spatialization of extremes using IDW, the analysis
the national scale in Senegal. of interannual variability using the Lamb index, and
Thus, this work projected the future evolution trend detection using the Mann-Kendall test.
of extreme heat for the periods 2051 – 2080 and The observed dynamics of minimum temperatures
2051 – 2080 with an upward trend across all scenarios. range from 28°C to 36°C across all scenarios. In
A comparative analysis of extreme temperature trends SSP1-2.6, almost the entire country shows dynamics
using different outputs of CMIP6 would be a relevant of minimum temperatures below 32°C, particularly
direction for future studies. in the western region. In SSP2-4.5, minimum
temperatures range from 32°C to 34°C nearly across
5. Conclusion the entire territory, while temperatures below 32°C
are noted at the stations in the south-central region.
This study aimed to analyze the evolution and future In SSP5-8.5, minimum temperatures exceed 32°C
trends of heat waves over the periods 2021 – 2050 across all stations but remain below 36°C. In addition,
and 2051 – 2080. The data from the CanESM5 model mean temperatures range from 32°C to 40°C with
were resampled and extracted based on the coordinates similar patterns across all scenarios. The lowest
of 40 stations selected for this study. Minimum, values (32°C – 34°C) are observed in the western
mean, and maximum temperatures were examined region, while the central region shows moderate
under three scenarios (SSP1-2.6, SSP2-4.5, and values (34°C – 36°C). Elevated mean temperatures
Volume 22 Issue 3 (2025) 148 doi: 10.36922/AJWEP025150107