
Page 149 - AJWEP-v22i3
P. 149
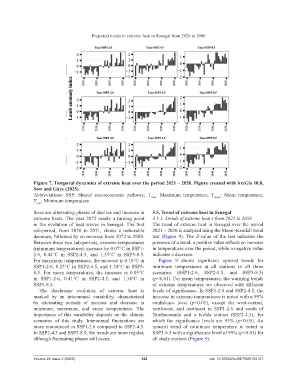
Projected trends in extreme heat in Senegal from 2020 to 2080


                Figure 7. Temporal dynamics of extreme heat over the period 2021 – 2050. Figure created with ArcGis 10.8,
                Sow and Gaye (2025).
                Abbreviations:  SSP: Shared socioeconomic  pathway;  T max : Maximum temperature;  T mean : Mean temperature;
                T : Minimum temperature.
                 min
                there are alternating phases of decline and increase in   3.5. Trend of extreme heat in Senegal
                extreme heats. The year 2072 marks a turning point   3.5.1. Trends of extreme heat s from 2021 to 2050
                in  the  evolution  of  heat  waves  in  Senegal. The  first   The trend of extreme heat in Senegal over the period
                sub-period, from 2050 to 2071, shows a noticeable   2021 – 2050 is analyzed using the Mann–Kendall trend
                decrease, followed by an increase from 2072 to 2080.   test (Figure  9). The  Z-value of the test indicates the
                Between these two sub-periods, extreme temperatures   presence of a trend: a positive value reflects an increase
                (minimum temperatures) increase by 0.07°C in SSP1-  in temperatures over the period, while a negative value
                2.6,  0.44°C  in  SSP2-4.5,  and  1.35°C  in  SSP5-8.5.   indicates a decrease.
                For maximum temperatures, the increase is 0.16°C in    Figure  9  shows  significant  upward  trends  for
                SSP1-2.6, 0.23°C in SSP2-4.5, and 1.34°C in SSP5-   minimum temperatures at  all  stations in  all  three
                8.5.  For  mean  temperatures,  the  increase  is  0.05°C   scenarios (SSP1-2.6, SSP2-4.5, and SSP5-8.5)
                in  SSP1-2.6,  0.41°C  in  SSP2-4.5,  and  1.34°C  in   (p<0.01). For mean temperatures, the warming trends
                SSP5-8.5.                                           of  extreme  temperatures  are  observed  with  different
                  The  diachronic  evolution  of extreme  heat  is   levels of significance. In SSP1-2.6 and SSP2-4.5, the
                marked by an interannual  variability, characterized   increase in extreme temperatures is noted with a 99%
                by alternating periods of increase  and decrease  in   confidence  level  (p<0.01), except for west-central,
                minimum,  maximum,  and mean temperatures.  The     northwest, and northeast in SSP1-2.6 and south of
                importance  of this variability depends on the climate   Tambacounda  and  a  Kolda  station  (SSP2-4.5),  for
                scenarios  of  this  study.  Interannual  fluctuations  are   which  the  significance  levels  are  95%  (p<0.05). An
                more pronounced in SSP1-2.6 compared to SSP2-4.5.   upward trend of minimum temperature is noted in
                In SSP2-4.5 and SSP5-8.5, the trends are more regular,   SSP5-8.5 with a significance level of 99% (p<0.01) for
                although fluctuating phases still occur.            all study stations (Figure 9).


                Volume 22 Issue 3 (2025)                       143                           doi: 10.36922/AJWEP025150107