
Page 150 - AJWEP-v22i3
P. 150
Sow and Gaye
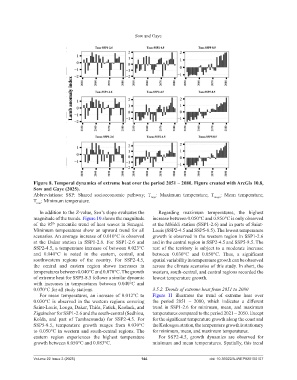
Figure 8. Temporal dynamics of extreme heat over the period 2051 – 2080. Figure created with ArcGis 10.8,
Sow and Gaye (2025).
Abbreviations: SSP: Shared socioeconomic pathway; T max : Maximum temperature; T mean : Mean temperature;
T : Minimum temperature.
min
In addition to the Z-value, Sen’s slope evaluates the Regarding maximum temperatures, the highest
magnitude of the trends. Figure 10 shows the magnitude increase between 0.050°C and 0.850°C is only observed
of the 95 percentile trend of heat waves in Senegal. at the Mbiddi station (SSP1-2.6) and in parts of Saint-
th
Minimum temperatures show an upward trend for all Louis (SSP2-4.5 and SSP5-8.5). The lowest temperature
scenarios. An average increase of 0.010°C is observed growth is observed in the western region in SSP1-2.6
at the Dakar station in SSP1-2.6. For SSP1-2.6 and and in the central region in SSP2-4.5 and SSP5-8.5. The
SSP2-4.5, a temperature increase of between 0.023°C rest of the territory is subject to a moderate increase
and 0.040°C is noted in the eastern, central, and between 0.030°C and 0.050°C. Thus, a significant
southwestern regions of the country. For SSP2-4.5, spatial variability in temperature growth can be observed
the central and eastern region shows increases in across the climate scenarios of this study. In short, the
temperatures between 0.040°C and 0.070°C. The growth western, south-central, and central regions recorded the
of extreme heat for SSP5-8.5 follows a similar dynamic lowest temperature growth.
with increases in temperatures between 0.040°C and
0.070°C for all study stations. 3.5.2. Trends of extreme heat from 2051 to 2080
For mean temperatures, an increase of 0.012°C to Figure 11 illustrates the trend of extreme heat over
0.030°C is observed in the western regions covering the period 2051 – 2080, which indicates a different
Saint-Louis, Louga, Dakar, Thiès, Fatick, Kaolack, and trend in SSP1-2.6 for minimum, mean, and maximum
Ziguinchor for SSP1-2.6 and the south-central (Sedhiou, temperatures compared to the period 2021 – 2050. Except
Kolda, and part of Tambacounda) for SSP2-4.5. For for the significant temperature growth along the coast and
SSP5-8.5, temperature growth ranges from 0.030°C the Kedougou station, the temperature growth is stationary
to 0.050°C in western and south-central regions. The for minimum, mean, and maximum temperatures.
eastern region experiences the highest temperature For SSP2-4.5, growth dynamics are observed for
growth between 0.050°C and 0.083°C. minimum and mean temperatures. Spatially, this trend
Volume 22 Issue 3 (2025) 144 doi: 10.36922/AJWEP025150107