
Page 147 - AJWEP-v22i3
P. 147
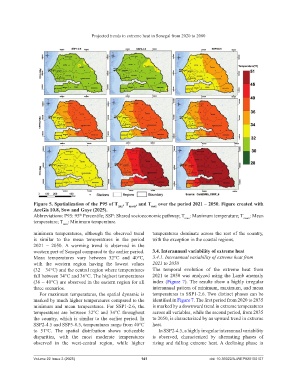
Projected trends in extreme heat in Senegal from 2020 to 2080


                Figure 5. Spatialization of the P95 of T , T mean , and T max  over the period 2021 – 2050. Figure created with
                                                     min
                ArcGis 10.8, Sow and Gaye (2025).
                Abbreviations: P95: 95  Percentile; SSP: Shared socioeconomic pathway; T max : Maximum temperature; T mean : Mean
                                    th
                temperature; T : Minimum temperature.
                             min
                minimum temperatures, although the observed trend   temperatures  dominate  across the  rest of the  country,
                is similar to the mean temperatures in the period   with the exception in the coastal regions.
                2021  –  2050.  A  warming  trend  is  observed  in  the
                western part of Senegal compared to the earlier period.   3.4. Interannual variability of extreme heat
                Mean  temperatures  vary  between  32°C  and  40°C,   3.4.1. Interannual variability of extreme heat from
                with the western region having the lowest values    2021 to 2050
                (32 – 34°C) and the central region where temperatures   The  temporal  evolution  of the  extreme  heat  from
                fall between 34°C and 36°C. The highest temperatures   2021 to 2050 was analyzed using the Lamb anomaly
                (36 – 40°C) are observed in the eastern region for all   index  (Figure  7). The  results  show a highly  irregular
                three scenarios.                                    interannual pattern of minimum, maximum, and mean
                  For maximum temperatures, the spatial dynamic is   temperatures in SSP1-2.6. Two distinct phases can be
                marked by much higher temperatures compared to the   identified in Figure 7. The first period from 2020 to 2035
                minimum  and mean temperatures.  For SSP1-2.6, the   is marked by a downward trend in extreme temperatures
                temperatures  are  between  32°C  and  34°C  throughout   across all variables, while the second period, from 2035
                the country, which is similar to the earlier period. In   to 2050, is characterized by an upward trend in extreme
                SSP2-4.5 and SSP5-8.5, temperatures range from 40°C   heat.
                to  51°C.  The  spatial  distribution  shows  noticeable   In SSP2-4.5, a highly irregular interannual variability
                disparities, with the most moderate temperatures    is observed, characterized  by alternating  phases of
                observed in the west-central region, while higher   rising and falling extreme heat. A  declining phase in


                Volume 22 Issue 3 (2025)                       141                           doi: 10.36922/AJWEP025150107