
Page 142 - AJWEP-v22i3
P. 142
Sow and Gaye
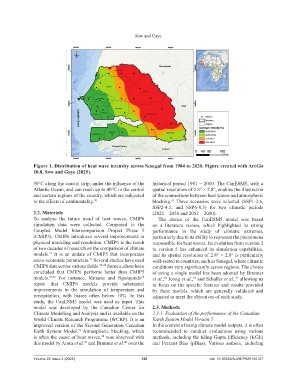
Figure 1. Distribution of heat wave intensity across Senegal from 1984 to 2020. Figure created with ArcGis
10.8, Sow and Gaye (2025).
30°C along the coastal strip, under the influence of the historical period 1981 – 2010. The CanESM5, with a
Atlantic Ocean, and can reach up to 40°C in the central spatial resolution of 2.8° × 2.8°, enables the illustration
and eastern regions of the country, which are subjected of the connections between heat waves and atmospheric
to the effects of continentality. 30 blocking. Three scenarios were selected (SSP1-2.6,
41
SSP2-4.5, and SSP6-8.5) for two climatic periods
2.2. Materials (2021 – 2050 and 2051 – 2080).
To analyze the future trend of heat waves, CMIP6 The choice of the CanESM5 model was based
simulation data were collected. Compared to the on a literature review, which highlighted its strong
Coupled Model Intercomparison Project Phase 5 performance in the study of climatic extremes,
(CMIP5), CMIP6 introduces several improvements in particularly due to its ability to represent the phenomena
physical modeling and resolution. CMIP6 is the result responsible for heat waves. Its evolution from version 2
of two decades of research on the comparison of climate to version 5 has enhanced its simulation capabilities,
models. It is an update of CMIP5 that incorporates and its spatial resolution of 2.8° × 2.8° is particularly
19
socio-economic parameters. Several studies have used well-suited to countries, such as Senegal, where climatic
31
CMIP6 data across various fields. 32-34 Some authors have conditions vary significantly across regions. The choice
concluded that CMIP6 performs better than CMIP5 of using a single model has been adopted by Brunner
models. 35,36 For instance, Mmame and Ngongondo et al., Jeong et al., and Schaller et al., allowing us
32
37
41
40
report that CMIP6 models provide substantial to focus on the specific features and results provided
improvements in the simulation of temperature and by these models, which are generally validated and
precipitation, with biases often below 10%. In this adjusted to meet the objectives of each study.
study, the CanESM5 model was used as input. This
model was developed by the Canadian Center for 2.3. Methods
Climate Modelling and Analysis and is available on the 2.3.1. Evaluation of the performance of the Canadian
World Climate Research Programme (WCRP). It is an Earth System Model Version 5
improved version of the Second Generation Canadian In the context of using climate model outputs, it is often
Earth System Model. Atmospheric blocking, which recommended to conduct evaluations using various
37
is often the cause of heat waves, was observed with methods, including the Kling-Gupta Efficiency (KGE)
38
this model by Arora et al. and Brunner et al. over the and Percent Bias (pBias). Various authors, including
39
40
Volume 22 Issue 3 (2025) 136 doi: 10.36922/AJWEP025150107