
Page 144 - AJWEP-v22i3
P. 144
Sow and Gaye
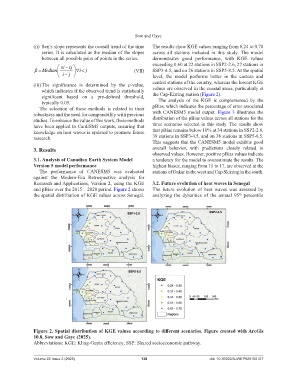
(ii) Sen’s slope represents the overall trend of the time The results show KGE values ranging from 0.24 to 0.78
series. It is calculated as the median of the slopes across all stations included in this study. The model
between all possible pairs of points in the series. demonstrates good performance, with KGE values
xi �� xj exceeding 0.60 at 22 stations in SSP2-2.6, 27 stations in
�
�� Median � �� ij (VII) SSP3-4.5, and on 26 stations in SSP5-8.5. At the spatial
�� i j level, the model performs better in the eastern and
(iii) The significance is determined by the p-value, central stations of the country, whereas the lowest KGE
which indicates if the observed trend is statistically values are observed in the coastal areas, particularly at
significant based on a pre-defined threshold, the Cap-Kirring station (Figure 2).
typically 0.05. The analysis of the KGE is complemented by the
The selection of these methods is related to their pBias, which indicates the percentage of error associated
robustness and the need for comparability with previous with CANESM5 model output. Figure 3 illustrates the
studies. To enhance the value of this work, these methods distribution of the pBias values across all stations for the
have been applied to CanESM5 outputs, ensuring that three scenarios selected in this study. The results show
knowledge on heat waves is updated to promote future that pBias remains below 10% at 34 stations in SSP2-2.6,
research. 39 stations in SSP3-4.5, and on 38 stations in SSP5-8.5.
This suggests that the CANESM5 model exhibits good
3. Results overall behavior, with predictions closely related to
observed values. However, positive pBias values indicate
3.1. Analysis of Canadian Earth System Model a tendency for the model to overestimate the results. The
Version 5 model performance highest biases, ranging from 11 to 17, are observed at the
The performance of CANESM5 was evaluated stations of Dakar in the west and Cap Skirring in the south.
against the Modern-Era Retrospective analysis for
Research and Applications, Version 2, using the KGE 3.2. Future evolution of heat waves in Senegal
and pBias over the 2015 – 2020 period. Figure 2 shows The future evolution of heat waves was assessed by
the spatial distribution of KGE values across Senegal. analyzing the dynamics of the annual 95 percentile
th
Figure 2. Spatial distribution of KGE values according to different scenarios. Figure created with ArcGis
10.8, Sow and Gaye (2025).
Abbreviations: KGE: Kling-Gupta efficiency; SSP: Shared socioeconomic pathway.
Volume 22 Issue 3 (2025) 138 doi: 10.36922/AJWEP025150107