
Page 148 - AJWEP-v22i3
P. 148
Sow and Gaye
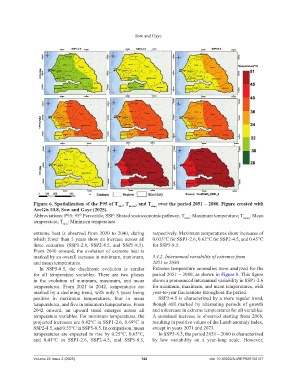
Figure 6. Spatialization of the P95 of T , T mean , and T max over the period 2051 – 2080. Figure created with
min
ArcGis 10.8, Sow and Gaye (2025).
Abbreviations: P95: 95 Percentile; SSP: Shared socioeconomic pathway; T max : Maximum temperature; T mean : Mean
th
temperature; T : Minimum temperature.
min
extreme heat is observed from 2020 to 2040, during respectively. Maximum temperatures show increases of
which fewer than 5 years show an increase across all 0.035°C for SSP1-2.6, 0.62°C for SSP2-4.5, and 0.45°C
three scenarios (SSP1-2.6, SSP2-4.5, and SSP5-8.5). for SSP5-8.5.
From 2040 onward, the evolution of extreme heat is
marked by an overall increase in minimum, maximum, 3.4.2. Interannual variability of extremes from
and mean temperatures. 2051 to 2080
In SSP5-8.5, the diachronic evolution is similar Extreme temperature anomalies were analyzed for the
for all temperature variables. There are two phases period 2051 – 2080, as shown in Figure 8. This figure
in the evolution of minimum, maximum, and mean shows a pronounced interannual variability in SSP1-2.6
temperatures. From 2021 to 2042, temperatures are for minimum, maximum, and mean temperatures, with
marked by a declining trend, with only 5 years being year-to-year fluctuations throughout the period.
positive in maximum temperatures, four in mean SSP2-4.5 is characterized by a more regular trend,
temperatures, and five in minimum temperatures. From though still marked by alternating periods of growth
2042 onward, an upward trend emerges across all and a decrease in extreme temperatures for all variables.
temperature variables. For minimum temperatures, the A sustained increase is observed starting from 2068,
projected increases are 0.42°C in SSP1-2.6, 0.69°C in resulting in positive values of the Lamb anomaly index,
SSP2-4.5, and 0.55°C in SSP5-8.5. In comparison, mean except in years 2071 and 2073.
temperatures are expected to rise by 0.25°C, 0.65°C, In SSP5-8.5, the period 2051 – 2080 is characterized
and 0.41°C in SSP1-2.6, SSP2-4.5, and SSP5-8.5, by low variability on a year-long scale. However,
Volume 22 Issue 3 (2025) 142 doi: 10.36922/AJWEP025150107