
Page 145 - AJWEP-v22i3
P. 145
Projected trends in extreme heat in Senegal from 2020 to 2080
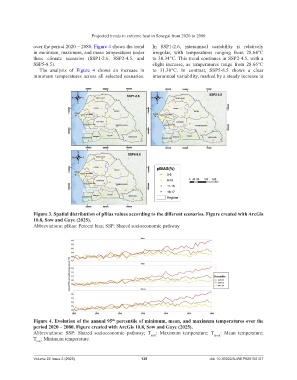
over the period 2020 – 2080. Figure 4 shows the trend In SSP1-2.6, interannual variability is relatively
in minimum, maximum, and mean temperatures under irregular, with temperatures ranging from 28.64°C
three climate scenarios (SSP1-2.6, SSP2-4.5, and to 30.34°C. This trend continues in SSP2-4.5, with a
SSP5-8.5). slight increase, as temperatures range from 28.66°C
The analysis of Figure 4 shows an increase in to 31.30°C. In contrast, SSP5-8.5 shows a clear
minimum temperatures across all selected scenarios. interannual variability, marked by a steady increase in
Figure 3. Spatial distribution of pBias values according to the different scenarios. Figure created with ArcGis
10.8, Sow and Gaye (2025).
Abbreviations: pBias: Percent bias; SSP: Shared socioeconomic pathway.
Figure 4. Evolution of the annual 95 percentile of minimum, mean, and maximum temperatures over the
th
period 2020 – 2080. Figure created with ArcGis 10.8, Sow and Gaye (2025).
Abbreviations: SSP: Shared socioeconomic pathway; T : Maximum temperature; T : Mean temperature;
T : Minimum temperature. max mean
min
Volume 22 Issue 3 (2025) 139 doi: 10.36922/AJWEP025150107