
Page 54 - AJWEP-v22i3
P. 54
Almoshadak
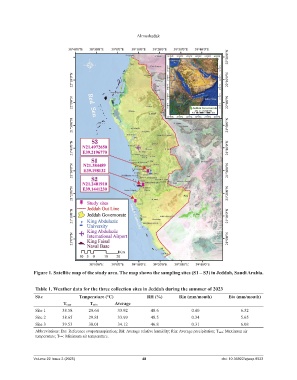
Figure 1. Satellite map of the study area. The map shows the sampling sites (S1 – S3) in Jeddah, Saudi Arabia.
Table 1. Weather data for the three collection sites in Jeddah during the summer of 2023
Site Temperature (°C) RH (%) Rin (mm/month) Εto (mm/month)
T max T min Average
Site 1 38.58 29.64 33.92 48.6 0.40 6.32
Site 2 38.65 29.81 33.99 48.5 0.34 5.65
Site 3 39.53 30.01 34.12 46.8 0.31 6.08
Abbreviations: Eto: Reference evapotranspiration; RH: Average relative humidity; Rin: Average precipitation; T max: Maximum air
temperature; T min: Minimum air temperature.
Volume 22 Issue 3 (2025) 48 doi: 10.36922/ajwep.8523