
Page 55 - AJWEP-v22i3
P. 55
Phytochemical and functional traits of Suaeda monoica
levels, electrical conductivity (EC [mS/cm]), total with the Coomassie brilliant blue G250 reagent, and the
dissolved solutes (TDS [mg/L]), organic matter results were expressed in mg/g DM.
(OM [%]), as well as various anions (phosphate, The amino acid content of S. monoica leaf and root
sulfate, nitrate, carbonate, and bicarbonate) and cations samples was analyzed using the ninhydrin assay on the
(sodium, potassium, calcium, and magnesium). The ethanolic extract, with glycine as a standard. After the
22
determined concentrations of anions and cations were reaction mixture was boiled, cooled, and shaken well,
expressed in milliequivalents per liter (meq/l), as the absorbance at 570 nm was used to calculate the
detailed in Table 2. amino acid content in mg/g DM.
Proline level was estimated using the method of
2.4. Plant analyses Bates et al. The plant materials were homogenized
23
The leaf photosynthetic pigments were extracted using in 3% aqueous sulfosalicylic acid, and the supernatant
85% cold acetone and subjected to centrifugation at from centrifugation was utilized for proline estimation.
10,000 rpm for 10 min. Their optical densities were Proline concentration in mg/g DM was calculated using
measured at 663, 644, and 452 nm. The quantification absorbance at 520 nm after the reaction mixture was
of each pigment (chlorophyll [Chl] a, Chl b, and extracted with toluene.
carotenoids) was conducted following the methodologies Total phenolic content was determined in the ethanolic
delineated by Metzner et al. and expressed in mg/g dry extracts based on the technique outlined by Jindal and
19
matter (DM). Singh. After mixing the extract with Folin-Ciocalteu’s
24
The dried powdered S. monoica leaf and root samples reagent and sodium carbonate, the absorbance at 650 nm
were extracted in a borate buffer (pH 8.5) and filtered was used for phenols quantification (mg/g DM).
through a Whatman No. 1 filter paper to determine Flavonoid content was determined using the
the total SS and protein content. The total content of colorimetric aluminum chloride method. Flavonoid
25
SSs in the filtrates was quantified using the phenol- quantification (mg/g DM) was performed at the
sulfuric acid method described by Dubois et al. with absorbance of 417 nm using a quercetin calibration
20
glucose as a standard sugar and expressed as mg/g DM. curve after mixing the ethanolic extract with aluminum
The total soluble protein (SP) content was determined chloride and potassium acetate.
following Bradford, employing bovine serum albumin Total alkaloid content was assessed (mg/g DM) by
21
as a protein standard. The absorbance at 595 nm was reacting bromocresol green with alkaloids in the ethanolic
measured after mixing the extract or standard protein extracts, using atropine as the reference alkaloid.
26
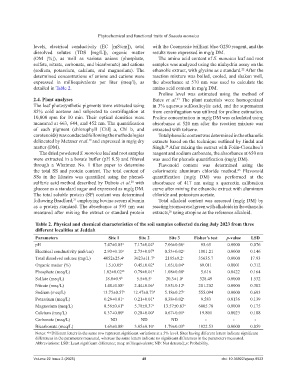
Table 2. Physical and chemical characteristics of the soil samples collected during July 2023 from three
different localities at Jeddah
Parameters Site 1 Site 2 Site 3 Fisher’s test p‑value LSD
pH 7.47±0.05 a 7.17±0.02 b 7.06±0.06 c 95.65 0.0000 0.076
Electrical conductivity (mS/cm) 2.93±0.10 a 2.73±0.07 b 0.53±0.02 c 1001.21 0.0000 0.146
Total dissolved solutes (mg/L) 4052±25.4 a 3623±11.7 b 2185±9.2 c 35635.7 0.0000 17.93
Organic matter (%) 1.5±0.05 a 0.45±0.02 b 1.65±0.04 a 69.011 0.0001 0.312
Phosphate (meq/L) 1.02±0.02 ab 0.79±0.01 b 1.08±0.08 a 5.616 0.0422 0.164
Sulfate (meq/L) 18.0±0.9 b 5.5±0.5 c 20.3±1.0 a 328.49 0.0000 1.532
Nitrate (meq/L) 1.40±0.08 c 2.44±0.06 b 3.85±0.12 a 201.202 0.0000 0.302
Sodium (meq/L) 13.75±0.57 a 12.47±0.73 b 5.18±0.27 c 555.094 0.0000 0.693
Potassium (meq/L) 0.29±0.01 a 0.21±0.01 b 0.38±0.02 a 9.583 0.0136 0.139
Magnesium (meq/L) 8.56±0.61 b 5.78±0.37 c 13.57±0.83 a 6005.78 0.0000 0.175
Calcium (meq/L) 0.37±0.00 b 0.28±0.00 b 0.67±0.01 a 19.801 0.0023 0.188
Carbonate (meq/L) ND ND ND - - -
Bicarbonate (meq/L) 1.69±0.08 c 3.05±0.10 a 1.79±0.03 b 1922.53 0.0000 0.059
Notes: a,b,c Different letters in the same row represent significant variations at a 5% level. Sites having different letters indicate significant
differences in the parameters measured, whereas the same letters indicate no significant differences in the parameters measured.
Abbreviations: LSD: Least significant difference; meq: milliequivalents; ND: Not detected; p: Probability.
Volume 22 Issue 3 (2025) 49 doi: 10.36922/ajwep.8523