
Page 57 - AJWEP-v22i3
P. 57
Phytochemical and functional traits of Suaeda monoica
Regarding mineral composition, site S3 surpassed and temperature can influence photosynthetic pigment
the other sites in phosphate, sulfate, nitrate, potassium, biosynthesis. 32,33 Therefore, higher salinity at site S3
magnesium, and calcium content (1.08, 20.3, may have triggered the accumulation of carotenoids as
3.85, 0.38, 13.57, and 0.67 meq/L, respectively). a protective mechanism against oxidative stress. The
Sodium concentration was highest at site S1 relatively lower salinity at site S1 may have favored
(13.75 meq/L), whereas bicarbonate levels peaked at Chl synthesis. Genetic differences among S. monoica
site S2 (3.05 meq/L). Interestingly, carbonate anion was populations at the investigated sites could also contribute
undetected across all study sites. Overall, soil analysis to the observed variations, as genetic diversity often
indicated that site S3 was the most favorable for optimal underlies differential stress responses in halophytes. 44
crop growth due to its physical attributes, low salinity, Previous studies have demonstrated varying Chl
and abundance of essential nutrients required for plant responses in halophytes under saline conditions,
growth and development. with some species showing enhanced Chl levels in
correlation with salt concentration, whereas others
3.2. Photosynthetic pigments in S. monoica leaves exhibit no significant changes. The increased Chl
34
The impact of the collection site on photosynthetic content in S. monoica at site S1 in response to salinity
pigment levels in S. monoica leaves from the study sites is can be attributed to enhanced energy production
detailed in Table 3. Statistical analysis revealed that Chl for stress management, growth promotion, osmotic
a and carotenoids exhibited highly significant increases stress mitigation, oxidative damage protection, and
(p<0.01) in response to collection sites, whereas Chl b overall performance optimization in high-salinity
was significantly affected (p<0.05) by site. Leaves from conditions. 32,33 Moreover, the heightened carotenoid
site S1 exhibited the highest Chl a and Chl b contents levels at the most saline site (S3) suggest that increasing
(0.60 and 0.37 mg/g DM, respectively). In contrast, carotenoid concentrations may serve as a strategy to
those from S3 showed the highest carotenoid content maintain Chl levels rather than diminishing them across
(0.74 mg/g DM), which was relatively close to that of varying salinity levels. This aligns with the studies
37
carotenoids of leaves collected from S1 (0.71 mg/g DM). associating elevated carotenoid levels with increased
The findings suggest that S1 fostered optimal growth salt tolerance in some plant species. 35,38
conditions for S. monoica due to its elevated Chl levels,
reinforcing the halophytic nature of the plant, which 3.3. Osmomodulatory compounds in S. monoica
thrives in saline environments. The results also support roots and leaves
the hypothesis that plants of the same species exhibit The levels of osmomodulatory compounds, including
diverse responses to salinity through quantitative and SSs, SPs, free amino acids (FAA), and free proline
qualitative variations in their adaptive mechanisms. 31 (FP), in S. monoica roots and leaves in response to the
The observed differences in photosynthetic pigment collection sites are delineated in Table 4. Statistically,
levels between sites could be attributed to environmental the difference in collection sites had a highly significant
factors and genetic variability. Environmental conditions impact (p<0.01) on the levels of all osmoregulatory
such as salinity, nutrient availability, light intensity, molecules measured in both the roots and leaves of
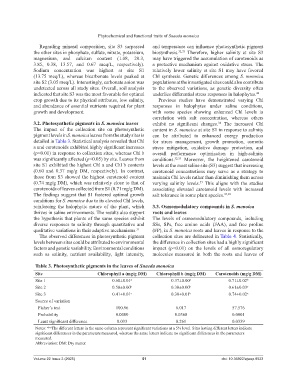
Table 3. Photosynthetic pigments in the leaves of Suaeda monoica
Site Chlorophyll a (mg/g DM) Chlorophyll b (mg/g DM) Carotenoids (mg/g DM)
Site 1 0.60±0.01 a 0.37±0.00 a 0.71±0.02 b
Site 2 0.50±0.00 b 0.30±0.00 b 0.61±0.03 c
Site 3 0.41±0.01 c 0.30±0.01 b 0.74±0.02 a
Source of variation
Fisher’s test 100.96 6.017 57.576
Probability 0.0000 0.0368 0.0001
Least significant difference 0.033 0.261 0.0339
Notes: a,b,c The different letters in the same column represent significant variations at a 5% level. Sites having different letters indicate
significant differences in the parameters measured, whereas the same letters indicate no significant differences in the parameters
measured.
Abbreviation: DM: Dry matter.
Volume 22 Issue 3 (2025) 51 doi: 10.36922/ajwep.8523