
Page 53 - AN-1-1
P. 53
Advanced Neurology EPAC2 null leads to tauopathy
primary antibody overnight at 4°C in phosphate-buffered assess the statistical significance of differences among the
saline containing 0.3% Triton X-100. The sections were means for multigroup comparisons. A difference with
incubated with secondary antibody for 1 h at 25°C in the P < 0.05 was considered statistically significant.
dark. The immunoreaction was detected by incubation
with horseradish peroxidase-labeled antibodies for 1 h at 3. Results
37°C and visualized with the DAB-tetrachloride system 3.1. Downregulation of EPAC2 induces age-
(Solelybio, Beijing, China). For each primary antibody,
3–5 consecutive sections from each brain were used. The dependent tau hyperphosphorylation
images were observed under a microscope (Olympus As EPAC2 is downregulated in the AD brain, we first
BX60). The primary antibodies employed in this study are evaluated tau phosphorylation in the hippocampus of
listed below (Table 1). EPAC2 mice on the 6 month. Immunoreactivities for the
−/−
th
pT205, pT231, pS396, and pS404 epitopes and decreased
2.9. Imaging and statistical analysis staining for Tau-1 were observed in the EPAC2 mice,
−/−
ImageJ (NIH, Bethesda, MD, USA) was used to measure suggesting hyperphosphorylation of tau at the Ser396/404
the immunohistochemical optical density. All the data (pS396, pS404), Thr231 (pT231), Thr205 (pT205), and
in the study were expressed as mean ± standard error of Ser199/202 (Tau-1) sites (Figure 1H and I). We also
the mean and analyzed with SPSS 16.0 statistical software examined the distribution of hyperphosphorylated tau at
−/−
(SPSS, Chicago, IL, USA). One-way analysis of variance, Thr205 and Ser396 in the hippocampus of EPAC2 mice.
followed by Student–Newman–Keuls test, was used to The staining for pT205 and pS396 was much stronger in the
A B E H I
C D F G
J K L M
N O
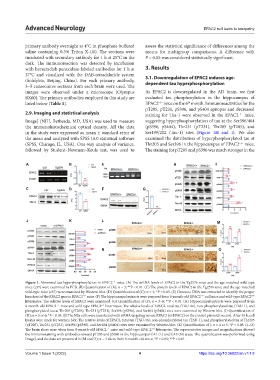
Figure 1. Abnormal tau hyperphosphorylation in EPAC2 mice. (A) The mRNA levels of EPAC2 in the Tg2576 mice and the age-matched wild-type
−/−
mice (c57) were examined by PCR. (B) Quantification of (A); n = 3; **P < 0.01. (C) The protein levels of EPAC2 in the Tg2576 mice and the age-matched
wild-type mice (c57) were examined by Western blot. (D) Quantification of (C); n = 4, *P < 0.05. (E) Genomic DNA was extracted to identify the proper
knockout of the EPAC2 gene in EPAC2 mice. (F) The hippocampal extracts were prepared from 6-month-old EPAC2 null mice and wild-type EPAC2
−/−
+/+
−/−
littermates. The relative levels of EPAC2 were examined. (G) Quantification of (F); n = 3–6; **P < 0.01. (H) Hippocampal extracts were prepared from
6-month-old EPAC2 mice and wild-type EPAC2 littermates. The relative levels of EPAC2, total tau (TAU-46), non-phosphorylated tau (TAU-1), and
+/+
−/−
phosphorylated tau at Thr205 (pT205), Thr231 (pT231), Ser396 (pS396), and Ser404 (pS404) sites were examined by Western blot. (I) Quantification of
(H); n = 5 or 6; *P < 0.05. (J) The N2a cells were transfected with siRNA targeting mouse EPAC2 (si-EPAC2) or the control plasmid (vector). After 48 h, cell
lysates were made for western blot. The relative levels of EPAC2, total tau (TAU-46), non-phosphorylated tau (TAU-1), and phosphorylated tau at Thr205
(pT205), Thr231 (pT231), Ser396 (pS396), and Ser404 (pS404) sites were examined by Western blot. (K) Quantification of J; n = 4 or 5; *P < 0.05. (L–O)
The brain slices were taken from 9-month-old EPAC2 mice and wild-type EPAC2 littermates. The representative images and magnifications showed
−/−
+/+
the immunostaining with antibodies toward pT205 and pS396 in the hippocampal CA1 (L) and CA3 (N) areas. The quantification was performed using
ImageJ, and the data are presented in (M and O); n = 4 slices from 9-month-old mice; *P < 0.05; **P < 0.01.
Volume 1 Issue 1 (2022) 4 https://doi.org/10.36922/an.v1i1.8