
Page 59 - AN-2-1
P. 59
Advanced Neurology Restless legs syndrome in end-stage renal disease patients
3. Results scores, except the subscales “physical component score,”
“social functioning,” and “general health” (P < 0.005). The
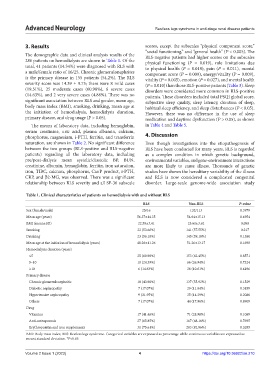
The demographic data and clinical analysis results of the RLS-negative patients had higher scores on the subscales
286 patients on hemodialysis are shown in Table 1. Of the physical functioning (P = 0.019), role limitations due
total, 41 patients (14.34%) were diagnosed with RLS with to physical health (P = 0.018), pain (P = 0.011), mental
a male/female ratio of 16/25. Chronic glomerulonephrites component score (P = 0.009), energy/vitality (P = 0.009),
is the primary disease in 155 patients (54.2%). The RLS vitality (P = 0.005), emotion (P = 0.027), and mental health
severity score was 14.39 ± 9.75; there were 8 mild cases (P = 0.010) than those RLS-positive patients (Table 3). Sleep
(19.51%), 25 moderate cases (60.98%), 6 severe cases disorders were considered more common in RLS-positive
(14.63%), and 2 very severe cases (4.88%). There was no patients. These disorders included total PSQI global score,
significant association between RLS and gender, mean age, subjective sleep quality, sleep latency, duration of sleep,
body mass index (BMI), smoking, drinking, mean age at habitual sleep efficiency, and sleep disturbances (P < 0.05).
the initiation of hemodialysis, hemodialysis duration, However, there was no difference in the use of sleep
primary disease, and drug usage (P > 0.05). medication and daytime dysfunction (P > 0.05), as shown
The means of laboratory data, including hemoglobin, in Table 4 and Table 5.
serum creatinine, uric acid, plasma albumin, calcium,
phosphorus, magnesium, i-PTH, ferritin, and transferrin 4. Discussion
saturation, are shown in Table 2. No significant difference Even though investigations into the etiopathogenesis of
between the two groups (RLS-positive and RLS-negative RLS have been conducted for many years, RLS is regarded
patients) regarding all the laboratory data, including as a complex condition in which genetic background,
pre/post-dialysis mean systolic/diastolic BP, BUN, environmental variables, and gene-environment interactions
creatinine, albumin, hemoglobin, ferritin, iron saturation, are more likely to cause illness. Thousands of genetic
iron, TIBC, calcium, phosphorus, Ca×P product, i-PTH, studies have shown the hereditary variability of the illness
CRP, and β2-MG, was observed. There was a significant and RLS is now considered a complicated congenital
relationship between RLS severity and all SF-36 subscale disorder. Large-scale genome-wide association study
Table 1. Clinical characteristics of patients on hemodialysis with and without RLS
RLS Non‑RLS P‑value
Sex (female/male) 25/16 132/113 0.3979
Mean age (years) 56.37±14.35 54.64±15.13 0.4954
BMI (mean±SD) 22.58±3.41 23.61±3.62 0.090
Smoking 22 (53.66%) 141 (57.55%) 0.217
Drinking 23 (56.10%) 145 (59.18%) 0.1380
Mean age at the initiation of hemodialysis (years) 48.26±11.26 51.26±13.17 0.1698
Hemodialysis duration (years)
≤5 25 (60.98%) 153 (62.45%) 0.8571
5–10 10 (24.39%) 66 (26.94%) 0.7324
≥10 6 (14.63%) 26 (10.61%) 0.4496
Primary disease
Chronic glomerulonephritis 18 (43.90%) 137 (55.92%) 0.1529
Diabetic nephropathy 7 (17.07%) 29 (11.84%) 0.3459
Hypertensive nephropathy 9 (21.95%) 35 (14.29%) 0.2080
Others 7 (17.07%) 44 (17.96%) 0.8909
Drug
Vitamins 17 (41.46%) 71 (28.98%) 0.1089
Anti-osteoporosis 27 (65.85%) 167 (68.16%) 0.7695
Erythropoietin and iron supplements 31 (75.61%) 203 (82.86%) 0.2655
BMI: Body mass index; RLS: Restless legs syndrome. Categorical variables are expressed as percentage while continuous variables are expressed as
mean±standard deviation. *P<0.05
Volume 2 Issue 1 (2023) 4 https://doi.org/10.36922/an.210