
Page 118 - AN-2-2
P. 118
Advanced Neurology Losartan and Enalapril in SE
cleaned in normal saline, and the blood vessels were taken A
out. Subsequently, the hearts were washed with normal
saline and dried by gently blotting them on tissue paper.
The hearts were weighed, and the heart-to-body weight
ratio was calculated using the provided formula: (heart
weight [g]/body weight [g]) × 1000.
2.6.3. Histopathology
To conduct histopathological analysis, sections of the
heart were fixed in 10% buffered formalin and underwent
routine automated histokinetic processing. Paraffin blocks
were created, and 3 – 5 µm sections were sliced using a
microtome (Shandon AS 325). These sections were then B
stained with hematoxylin and eosin (H&E) to identify
histopathological changes, such as inflammation, necrosis,
ischemia, and fibrosis. The evaluation of these findings was
performed by a cardiac pathologist who was unaware of
the experimental groups.
2.7. Statistical analysis
The analyses were conducted by an unbiased observer
who was unaware of the experimental groups, utilizing
GraphPad Prism 5.0. For data relating to SCS, to ensure a
comparable group size, data are plotted till day 15 only as
there was mortality in LiP control group after that. While
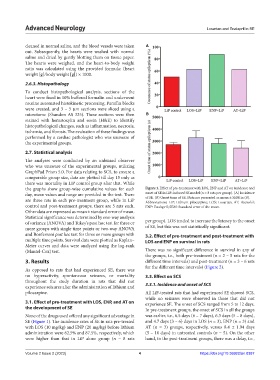
the graphs show group-wise cumulative values for each Figure 1. Effect of pre-treatment with LOS, ENP and AT on incidence and
day, mean values and range are provided in the text. There onset of SE in LiP-induced SE model (n = 8 rats per group). (A) Incidence
of SE. (B) Onset time of SE. Data are presented as mean ± SEM in (B).
are three rats in each pre-treatment group, while in LiP Abbreviations: LiP: Lithium-pilocarpine; LOS: Losartan; AT: Atenolol;
control and post-treatment groups, there are 5 rats each. ENP: Enalapril; SEM: Standard error of the mean.
Other data are expressed as mean ± standard error of mean.
Statistical significance was determined by one-way analysis
of variance (ANOVA) and Tukey’s post hoc test for three or per group). LOS tended to increase the latency to the onset
more groups with single time points or two-way ANOVA of SE, but this was not statistically significant.
and Bonferroni post hoc test for three or more groups with 3.2. Effect of pre-treatment and post-treatment with
multiple time points. Survival data were plotted as Kaplan– LOS and ENP on survival in rats
Meier curves and data were analyzed using the log-rank
(Mantel-Cox) test. There was no significant difference in survival in any of
the groups, i.e., both pre-treatment (n = 2 – 5 rats for the
3. Results different time intervals) and post-treatment (n = 3 – 6 rats
for the different time intervals) (Figure 2).
As opposed to rats that had experienced SE, there was
no hyperactivity, spontaneous seizures, or mortality 3.3. Effect on SCS
throughout the study duration in rats that did not
experience seizures after the administration of lithium and 3.3.1. Incidence and onset of SCS
pilocarpine. All LiP-treated rats that had experienced SE showed SCS,
while no seizures were observed in those that did not
3.1. Effect of pre-treatment with LOS, ENP, and AT on experience SE. The onset of SCS ranged from 5 to 12 days.
the development of SE In pre-treatment groups, the onset of SCS in all the groups
None of the drugs used offered any significant advantage in was earlier, i.e., 6.5 days (6 – 7 days), 6.3 days (5 – 8 days),
SE (Figure 1). The incidence rates of SE in rats pre-treated and 4.7 days (3 – 6) days in LOS (n = 3), ENP (n = 3) and
with LOS (10 mg/kg) and ENP (20 mg/kg) before lithium AT (n = 3) groups, respectively, versus 8.4 ± 1.94 days
administration were 62.5% and 87.5%, respectively, which (5 – 10 days) in untreated controls (n = 5). On the other
were higher than that in LiP alone group (n = 8 rats hand, in the post-treatment groups, there was a delay, i.e.,
Volume 2 Issue 2 (2023) 4 https://doi.org/10.36922/an.0387