
Page 119 - AN-2-2
P. 119
Advanced Neurology Losartan and Enalapril in SE
A B
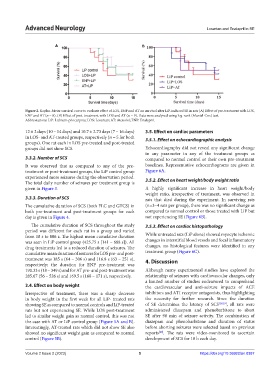
Figure 2. Kaplan-Meier survival curve to evaluate effect of LOS, ENP and AT on survival after LiP-induced SE in rats (A) Effect of pre-treatment with LOS,
ENP and AT (n = 8). (B) Effect of post-treatment with LOS and AT (n = 9). Data were analyzed using log-rank (Mantel-Cox) test.
Abbreviations: LiP: Lithium-pilocarpine; LOS: Losartan; AT: Atenolol; ENP: Enalapril.
12 ± 2 days (10 – 14 days) and 10.7 ± 2.73 days (7 – 16 days) 3.5. Effect on cardiac parameters
in LOS- and AT-treated groups, respectively (n = 5 for both 3.5.1. Effect on echocardiographic analysis
groups). One rat each in LOS pre-treated and post-treated
groups did not show SCS. Echocardiography did not reveal any significant change
in any parameter in any of the treatment groups as
3.3.2. Number of SCS compared to normal control or their own pre-treatment
It was observed that as compared to any of the pre- baselines. Representative echocardiograms are given in
treatment or post-treatment groups, the LiP control group Figure 6A.
experienced more seizures during the observation period. 3.5.2. Effect on heart weight/body weight ratio
The total daily number of seizures per treatment group is
given in Figure 3. A highly significant increase in heart weight/body
weight ratio, irrespective of treatment, was observed in
3.3.3. Duration of SCS rats that died during the experiment. In surviving rats
The cumulative duration of SCS (both FLC and GTCS) in (n=3–4 rats per group), there was no significant change as
both pre-treatment and post-treatment groups for each compared to normal control or those treated with LiP but
day is given in Figure 4. not experiencing SE (Figure 6B).
The cumulative duration of SCS throughout the study 3.5.3. Effect on cardiac histopathology
period was different for each rat in a group and varied
from 18 s to 806 s. The highest mean cumulative duration While untreated rats (LiP alone) showed myocyte ischemic
was seen in LiP control group (425.75 s [141 – 688 s]). All changes in interstitial blood vessels and focal inflammatory
drug treatments led to a reduced duration of seizures. The changes, no histological features were identified in any
cumulative mean duration of seizures for LOS pre- and post- treatment group (Figure 6C).
treatment was 185 s (64 – 306 s) and 116.8 s (63 – 251 s), 4. Discussion
respectively; the duration for ENP pre-treatment was
190.33 s (18 – 349 s) and for AT pre- and post-treatment was Although many experimental studies have explored the
285.67 (56 – 526 s) and 169.5 s (168 – 171 s), respectively. relationship of seizures with cardiovascular changes, only
a limited number of studies endeavored to comprehend
3.4. Effect on body weight the cardiovascular and anti-seizure impacts of ACE
Irrespective of treatment, there was a sharp decrease inhibitors and AT1 receptor antagonists, thus highlighting
in body weight in the first week for all LiP- treated rats the necessity for further research. Since the duration
showing SE as compared to normal controls and LiP-treated of SE determines the latency of SCS [18,19] , all rats were
rats but not experiencing SE. While LOS post-treatment administered diazepam and phenobarbitone to abort
led to similar weight gain as normal control, this was not SE after 90 min of seizure activity. The combination of
the case with AT or LiP control group (Figure 5A and B). diazepam and phenobarbitone and duration of status
Interestingly, AT-treated rats which did not show SE also before aborting seizures were selected based on previous
showed no significant weight gain as compared to normal reports . The rats were video-monitored to ascertain
[20]
control (Figure 5B). development of SCS for 10 h each day.
Volume 2 Issue 2 (2023) 5 https://doi.org/10.36922/an.0387