
Page 40 - AN-2-4
P. 40
Advanced Neurology Evoked potential response in parkinsonian syndromes
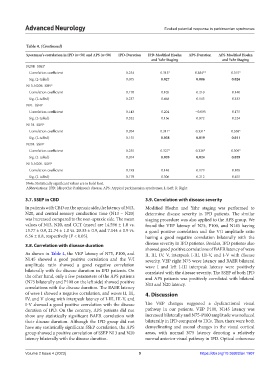
Table 4. (Continued)
Spearman's correlation in IPD (n=50) and APS (n=50) IPD‑Duration IPD‑Modified Hoehn APS‑Duration APS‑Modified Hoehn
and Yahr Staging and Yahr Staging
N20R_SSEP
Correlation coefficient 0.254 0.313* 0.384** 0.315*
Sig. (2-tailed) 0.075 0.027 0.006 0.026
N13-N20R_SSEP
Correlation coefficient 0.170 0.105 0.210 0.140
Sig. (2-tailed) 0.237 0.468 0.143 0.333
N9L_SSEP
Correlation coefficient 0.143 0.204 −0.005 0.175
Sig. (2-tailed) 0.322 0.156 0.972 0.224
N13L_SSEP
Correlation coefficient 0.204 0.311* 0.331* 0.358*
Sig. (2-tailed) 0.155 0.028 0.019 0.011
N20L_SSEP
Correlation coefficient 0.255 0.327* 0.320* 0.309*
Sig. (2-tailed) 0.074 0.020 0.024 0.029
N13-N20L_SSEP
Correlation coefficient 0.193 0.148 0.179 0.108
Sig. (2-tailed) 0.179 0.306 0.212 0.455
Note: Statistically significant values are in bold font.
Abbreviations: IPD: Idiopathic Parkinson’s disease; APS: Atypical parkinsonian syndromes; L: Left; R: Right.
3.7. SSEP in CBD 3.9. Correlation with disease severity
In patients with CBD on the apraxic side, the latency of N13, Modified Hoehn and Yahr staging was performed to
N20, and central sensory conduction time (N13 – N20) determine disease severity in IPD patients. The similar
was increased compared to the non-apraxic side. The mean staging procedure was also applied to the APS group. We
values of N13, N20, and CCT (msec) are 14.596 ± 1.0 vs. found the VEP latency of N75, P100, and N145 having
13.77 ± 0.9, 21.74 ± 1.0 vs. 20.33 ± 0.9, and 7.144 ± 0.9 vs. a good positive correlation and the V/I amplitude ratio
6.56 ± 0.8, respectively (P < 0.05). having a good negative correlation bilaterally with the
3.8. Correlation with disease duration disease severity in IPD patients. Besides, IPD patients also
showed good positive correlations of BAER latency of wave
As shown in Table 4, the VEP latency of N75, P100, and II, III, IV, V, interpeak I-III, III-V, and I-V with disease
N145 showed a good positive correlation and the V/I severity. VEP right N75 wave latency and BAER bilateral
amplitude ratio showed a good negative correlation wave I and left I-III interpeak latency were positively
bilaterally with the disease duration in IPD patients. On correlated with the disease severity. The SSEP of both IPD
the other hand, only a few parameters of the APS patients and APS patients was positively correlated with bilateral
(N75 bilaterally and P100 on the left side) showed positive N13 and N20 latency.
correlations with the disease duration. The BAER latency
of wave I showed a negative correlation, and waves II, III, 4. Discussion
IV, and V along with interpeak latency of I-III, III-V, and
I-V showed a good positive correlation with the disease The VEP changes suggested a dysfunctional visual
duration of IPD. On the contrary, APS patients did not pathway in our patients. VEP P100, N145 latency was
show any statistically significant BAER correlation with increased bilaterally and N75-P100 amplitude was reduced
their disease duration. Although the IPD group did not bilaterally in IPD compared to HCs. Thus, there were both
have any statistically significant SSEP correlation, the APS demyelinating and axonal changes in the visual cortical
group showed a positive correlation of SSEP N13 and N20 areas, with normal N75 latency denoting a relatively
latency bilaterally with the disease duration. normal anterior visual pathway in IPD. Optical coherence
Volume 2 Issue 4 (2023) 9 https://doi.org/10.36922/an.1907