
Page 36 - AN-2-4
P. 36
Advanced Neurology Evoked potential response in parkinsonian syndromes
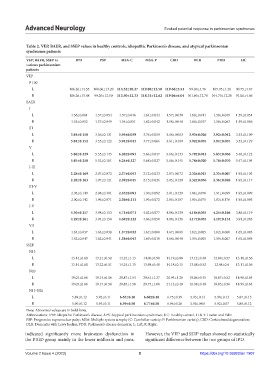
Table 2. VEP, BAER, and SSEP values in healthy controls, idiopathic Parkinson’s disease, and atypical parkinsonian
syndromes patients
VEP, BAER, SSEP in IPD PSP MSA‑C MSA‑P CBD DLB PDD HC
various parkinsonism
patients
VEP
P 100
L 106.26±14.55 100.06±13.20 114.32±10.27 119.88±12.58 119.66±5.54 99.00±4.76 105.95±1.20 90.75±4.67
R 106.26±15.88 99.20±12.50 113.50±12.33 118.31±12.62 119.06±6.04 101.60±12.78 104.70±12.28 91.00±4.66
BAER
I
L 1.56±0.061 1.57±0.054 1.57±0.046 1.64±0.044 1.57±0.030 1.60±0.011 1.58±0.049 1.59±0.051
R 1.55±0.052 1.57±0.049 1.54±0.051 1.62±0.042 1.58±0.040 1.60±0.037 1.58±0.063 1.59±0.056
III
L 3.84±0.150 3.56±0.131 3.95±0.039 3.76±0.059 3.64±0.063 3.93±0.026 3.92±0.042 3.53±0.109
R 3.84±0.152 3.55±0.122 3.94±0.043 3.77±0.066 3.61±0.109 3.92±0.055 3.94±0.035 3.53±0.129
V
L 5.86±0.239 5.55±0.145 6.28±0.093 5.66±0.047 5.66±0.133 5.79±0.043 5.83±0.056 5.46±0.122
R 5.85±0.250 5.52±0.161 6.24±0.127 5.68±0.027 5.66±0.145 5.78±0.020 5.78±0.070 5.47±0.104
I-III
L 2.28±0.169 2.07±0.072 2.37±0.053 2.12±0.033 2.07±0.072 2.32±0.015 2.33±0.007 1.93±0.103
R 2.28±0.163 1.97±0.121 2.39±0.045 2.15±0.026 2.05±0.120 2.32±0.036 2.36±0.028 1.93±0.117
III-V
L 2.03±0.149 2.08±0.481 2.33±0.091 1.90±0.092 2.01±0.129 1.86±0.070 1.91±0.099 1.93±0.099
R 2.00±0.142 1.96±0.071 2.30±0.111 1.90±0.072 2.05±0.107 1.85±0.075 1.83±0.176 1.93±0.093
I-V
L 4.30±0.257 3.98±0.153 4.71±0.071 4.02±0.077 4.08±0.129 4.18±0.055 4.24±0.106 3.86±0.119
R 4.29±0.264 3.94±0.158 4.69±0.122 4.06±0.050 4.08±0.136 4.17±0.055 4.19±0.134 3.91±0.283
V/I
L 1.64±0.037 1.63±0.030 1.37±0.032 1.67±0.000 1.67±0.061 1.62±0.005 1.62±0.000 1.65±0.043
R 1.62±0.047 1.62±0.041 1.38±0.043 1.69±0.010 1.64±0.048 1.59±0.005 1.59±0.007 1.65±0.045
SSEP
N13
L 13.14±0.60 13.21±0.50 14.24±1.13 14.00±0.90 14.19±0.88 13.12±0.48 12.89±0.57 13.10±0.56
R 13.14±0.60 13.22±0.51 14.24±1.15 13.98±0.48 14.18±0.15 13.08±0.52 12.88±0.6 13.11±0.56
N20
L 19.03±0.66 19.14±0.56 20.87±1.54 20.61±1.37 20.94±1.26 19.06±0.45 18.87±0.52 18.98±0.64
R 19.05±0.66 19.17±0.58 20.83±1.58 20.75±1.00 21.13±0.40 18.98±0.48 18.83±0.56 18.99±0.64
N13-N20
L 5.89±0.12 5.92±0.11 6.63±0.10 6.60±0.48 6.75±0.39 5.93±0.14 5.98±0.13 5.87±0.13
R 5.90±0.12 5.94±0.11 6.59±0.50 6.77±0.50 6.96±0.26 5.96±0.06 5.92±0.07 5.88±0.12
Note: Abnormal values are in bold fonts.
Abbreviations: IPD: Idiopathic Parkinson’s disease; APS: Atypical parkinsonian syndromes; HC: Healthy control, H & Y: Hoehn and Yahr,
PSP: Progressive supranuclear palsy; MSA: Multiple system atrophy (C: Cerebellar variety; P: Parkinsonian variety); CBD: Corticobasal degeneration;
DLB: Dementia with Lewy bodies; PDD: Parkinson’s disease dementia; L: Left; R: Right.
indicated significantly more brainstem dysfunction in However, the VEP and SSEP values showed no statistically
the PIGD group mainly in the lower midbrain and pons. significant difference between the two groups of IPD.
Volume 2 Issue 4 (2023) 5 https://doi.org/10.36922/an.1907