
Page 38 - AN-2-4
P. 38
Advanced Neurology Evoked potential response in parkinsonian syndromes
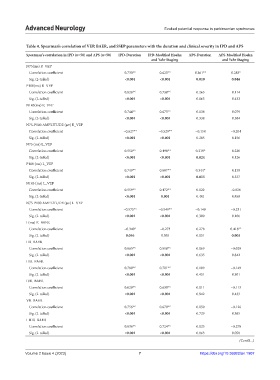
Table 4. Spearman’s correlation of VEP, BAER, and SSEP parameters with the duration and clinical severity in IPD and APS
Spearman's correlation in IPD (n=50) and APS (n=50) IPD‑Duration IPD‑Modified Hoehn APS‑Duration APS‑Modified Hoehn
and Yahr Staging and Yahr Staging
N75(ms) R_VEP
Correlation coefficient 0.730** 0.625** 0.361** 0.283*
Sig. (2-tailed) <0.001 <0.001 0.010 0.046
P100(ms) R_VEP
Correlation coefficient 0.826** 0.738** 0.265 0.114
Sig. (2-tailed) <0.001 <0.001 0.063 0.432
N145(ms) R_VEP
Correlation coefficient 0.744** 0.675** 0.138 0.079
Sig. (2-tailed) <0.001 <0.001 0.338 0.584
N75-P100 AMPLITUDE (μv) R_VEP
Correlation coefficient −0.627** −0.529** −0.154 −0.204
Sig. (2-tailed) <0.001 <0.001 0.285 0.156
N75 (ms) L_VEP
Correlation coefficient 0.550** 0.498** 0.319* 0.220
Sig. (2-tailed) <0.001 <0.001 0.024 0.126
P100 (ms) L_VEP
Correlation coefficient 0.749** 0.687** 0.344* 0.139
Sig. (2-tailed) <0.001 <0.001 0.015 0.337
N145 (ms) L_VEP
Correlation coefficient 0.559** 0.472** 0.122 -0.026
Sig. (2-tailed) <0.001 0.001 0.401 0.858
N75-P100 AMPLITUDE (μv) L_VEP
Correlation coefficient −0.575** −0.549** −0.149 −0.231
Sig. (2-tailed) <0.001 <0.001 0.300 0.106
I (ms) R_BAER
Correlation coefficient −0.340* −0.273 0.278 0.418**
Sig. (2-tailed) 0.016 0.055 0.051 0.003
IIR_BAER
Correlation coefficient 0.865** 0.818** 0.069 −0.029
Sig. (2-tailed) <0.001 <0.001 0.635 0.842
IIIR_BAER
Correlation coefficient 0.789** 0.701** 0.109 −0.149
Sig. (2-tailed) <0.001 <0.001 0.451 0.301
IVR_BAER
Correlation coefficient 0.629** 0.630** 0.011 −0.113
Sig. (2-tailed) <0.001 <0.001 0.942 0.433
VR_BAER
Correlation coefficient 0.756** 0.670** 0.050 −0.126
Sig. (2-tailed) <0.001 <0.001 0.729 0.385
I-IIIR_BAER
Correlation coefficient 0.836** 0.724** 0.025 −0.270
Sig. (2-tailed) <0.001 <0.001 0.863 0.058
(Cont’d...)
Volume 2 Issue 4 (2023) 7 https://doi.org/10.36922/an.1907