
Page 108 - AN-3-3
P. 108
Advanced Neurology Proteomic analysis of microglia exosomes
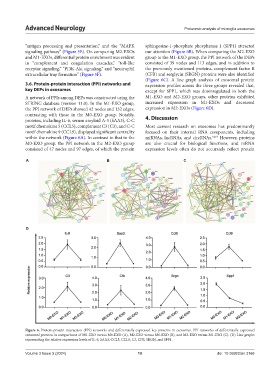
“antigen processing and presentation,” and the “MAPK sphingosine-1-phosphate phosphatase 1 (SPP1) attracted
signaling pathway” (Figure 5E). On comparing M2-EXOs our attention (Figure 6B). When comparing the M2-EXO
and M1-EXOs, differential protein enrichment was evident group to the M1-EXO group, the PPI network of the DEPs
in “complement and coagulation cascades,” “toll-like consisted of 39 nodes and 113 edges, and in addition to
receptor signaling,” “PI3K-Akt signaling,” and “neutrophil the previously mentioned proteins, complement factor B
extracellular trap formation” (Figure 5F). (CFB) and serglycin (SRGN) proteins were also identified
(Figure 6C). A line graph analysis of exosomal protein
3.6. Protein-protein interaction (PPI) networks and expression profiles across the three groups revealed that,
key DEPs in exosomes except for SPP1, which was downregulated in both the
A network of PPIs among DEPs was constructed using the M1-EXO and M2-EXO groups, other proteins exhibited
STRING database (version 11.0). In the M1-EXO group, increased expression in M1-EXOs and decreased
the PPI network of DEPs showed 42 nodes and 132 edges, expression in M2-EXOs (Figure 6D).
contrasting with those in the M0-EXO group. Notably,
proteins, including IL-6, serum amyloid A-3 (SAA3), C-C 4. Discussion
motif chemokine 5 (CCL5), complement C3 (C3), and C-C Most current research on exosomes has predominantly
motif chemokine 9 (CCL9), displayed significant centrality focused on their internal RNA components, including
within the network (Figure 6A). In contrast to that in the miRNAs, lncRNAs, and circRNAs. 18,19 However, proteins
M0-EXO group, the PPI network in the M2-EXO group are also crucial for biological functions, and mRNA
consisted of 47 nodes and 97 edges, of which the protein expression levels often do not accurately reflect protein
A B C
D
Figure 6. Protein-protein interaction (PPI) networks and differentially expressed key proteins in exosomes. PPI networks of differentially expressed
exosomal proteins in comparisons of M1-EXO versus M0-EXO (A), M2-EXO versus M0-EXO (B), and M2-EXO versus M1-EXO (C). (D) Line graphs
representing the relative expression levels of IL-6, SAA3, CCL5, CCL9, C3, CFB, SRGN, and SPP1.
Volume 3 Issue 3 (2024) 10 doi: 10.36922/an.3166