
Page 105 - AN-3-3
P. 105
Advanced Neurology Proteomic analysis of microglia exosomes
A C D
B
E F G
H I J K
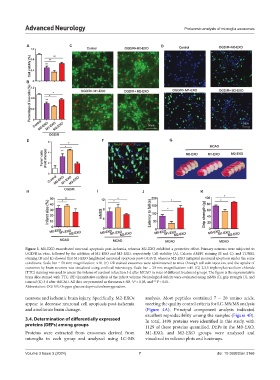
Figure 3. M1-EXO exacerbated neuronal apoptosis post-ischemia, whereas M2-EXO exhibited a protective effect. Primary neurons were subjected to
OGD/R in vitro, followed by the addition of M1-EXO and M2-EXO, respectively. Cell viability (A), Calcein AM/PI staining (B and C), and TUNEL
staining (D and E) showed that M1-EXO heightened neuronal apoptosis post-OGD/R, whereas M2-EXO mitigated neuronal apoptosis under the same
conditions. Scale bar = 50 nm; magnification: ×10. (F) Dil-stained exosomes were administered to mice through tail vein injection, and the uptake of
exosomes by brain neurons was visualized using confocal microscopy. Scale bar = 20 nm; magnification: ×40. (G) 2,3,5 triphenyltetrazolium chloride
(TTC) staining was used to assess the volume of cerebral infarction 3 d after MCAO in mice of different treatment groups. The figure is the representative
brain slice stained with TTC. (H) Quantitative analysis of the infarct volume. Neurological deficits were evaluated using mNSS (I), grip strength (J), and
rotarod (K) 3 d after tMCAO. All data are presented as the mean ± SD. *P < 0.05, and **P < 0.01.
Abbreviation: OGD/R: Oxygen-glucose deprivation/reoxygenation.
neurons and ischemic brain injury. Specifically, M2-EXOs analysis. Most peptides contained 7 – 20 amino acids,
appear to decrease neuronal cell apoptosis post-ischemia meeting the quality control criteria for LC-MS/MS analysis
and ameliorate brain damage. (Figure 4A). Principal component analysis indicated
excellent reproducibility among the samples (Figure 4B).
3.4. Determination of differentially expressed In total, 1498 proteins were identified in this study, with
proteins (DEPs) among groups 1129 of these proteins quantified. DEPs in the M0-EXO,
Proteins were extracted from exosomes derived from M1-EXO, and M2-EXO groups were analyzed and
microglia in each group and analyzed using LC-MS visualized in volcano plots and heatmaps.
Volume 3 Issue 3 (2024) 7 doi: 10.36922/an.3166