
Page 107 - AN-3-3
P. 107
Advanced Neurology Proteomic analysis of microglia exosomes
A B
C D
E F
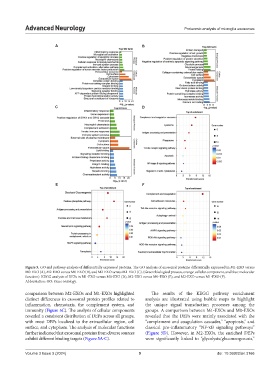
Figure 5. GO and pathway analysis of differentially expressed proteins. The GO analysis of exosomal proteins differentially expressed in M1-EXO versus
M0-EXO (A), M2-EXO versus M0-EXO (B), and M2-EXO versus M1-EXO (C). (Green: biological process, orange: cellular component, and blue: molecular
function). KEGG analysis of DEPs in M1-EXO versus M0-EXO (D), M2-EXO versus M0-EXO (E), and M2-EXO versus M1-EXO (F).
Abbreviation: GO: Gene ontology.
comparison between M2-EXOs and M1-EXOs highlighted The results of the KEGG pathway enrichment
distinct differences in exosomal protein profiles related to analysis are illustrated using bubble maps to highlight
inflammation, chemotaxis, the complement system, and the unique signal transduction processes among the
immunity (Figure 5C). The analysis of cellular components groups. A comparison between M1-EXOs and M0-EXOs
revealed a consistent distribution of DEPs across all groups, revealed that the DEPs were mainly associated with the
with most DEPs localized to the extracellular region, cell “complement and coagulation cascades,” “apoptosis,” and
surface, and cytoplasm. The analysis of molecular functions classical pro-inflammatory “NF-κB signaling pathways”
further indicated that exosomal proteins from diverse sources (Figure 5D). However, in M2-EXOs, the enriched DEPs
exhibit different binding targets (Figure 5A-C). were significantly linked to “glycolysis/gluconeogenesis,”
Volume 3 Issue 3 (2024) 9 doi: 10.36922/an.3166