
Page 106 - AN-3-3
P. 106
Advanced Neurology Proteomic analysis of microglia exosomes
A B
C D E
F G H
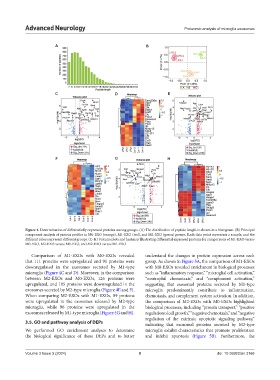
Figure 4. Determination of differentially expressed proteins among groups. (A) The distribution of peptide length is shown in a histogram. (B) Principal
component analysis of protein profiles in M0-EXO (orange), M1-EXO (red), and M2-EXO (green) groups. Each data point represents a sample, and the
different colors represent different groups. (C-H) Volcano plots and heatmap illustrating differential expressed proteins for comparisons of M1-EXO versus
M0-EXO, M2-EXO versus M0-EXO, and M2-EXO versus M1-EXO.
Comparison of M1-EXOs with M0-EXOs revealed understand the changes in protein expression across each
that 111 proteins were upregulated and 91 proteins were group. As shown in Figure 5A, the comparison of M1-EXOs
downregulated in the exosomes secreted by M1-type with M0-EXOs revealed enrichment in biological processes
microglia (Figure 4C and D). Moreover, in the comparison such as “inflammatory response,” “microglial cell activation,”
between M2-EXOs and M0-EXOs, 126 proteins were “neutrophil chemotaxis,” and “complement activation,”
upregulated, and 105 proteins were downregulated in the suggesting that exosomal proteins secreted by M1-type
exosomes secreted by M2-type microglia (Figure 4E and F). microglia predominantly contribute to inflammation,
When comparing M2-EXOs with M1-EXOs, 89 proteins chemotaxis, and complement system activation. In addition,
were upregulated in the exosomes released by M2-type the comparison of M2-EXOs with M0-EXOs highlighted
microglia, while 96 proteins were upregulated in the biological processes, including “protein transport,” “positive
exosomes released by M1-type microglia (Figure 4G and H). regulation of cell growth,” “negative chemotaxis,” and “negative
regulation of the extrinsic apoptotic signaling pathway,”
3.5. GO and pathway analysis of DEPs indicating that exosomal proteins secreted by M2-type
We performed GO enrichment analyses to determine microglia exhibit characteristics that promote proliferation
the biological significance of these DEPs and to better and inhibit apoptosis (Figure 5B). Furthermore, the
Volume 3 Issue 3 (2024) 8 doi: 10.36922/an.3166