
Page 103 - AN-3-3
P. 103
Advanced Neurology Proteomic analysis of microglia exosomes
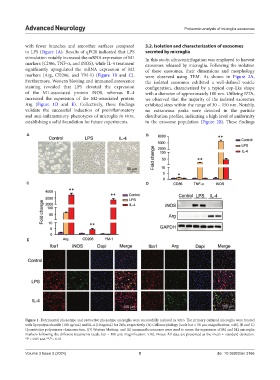
with fewer branches and smoother surfaces compared 3.2. Isolation and characterization of exosomes
to LPS (Figure 1A). Results of qPCR indicated that LPS secreted by microglia
stimulation notably increased the mRNA expression of M1 In this study, ultracentrifugation was employed to harvest
markers (CD86, TNF-α, and iNOS), while IL-4 treatment exosomes released by microglia. Following the isolation
significantly upregulated the mRNA expression of M2 of these exosomes, their dimensions and morphology
markers (Arg, CD206, and YM-1) (Figure 1B and C). were observed using TEM. As shown in Figure 2A,
Furthermore, Western blotting and immunofluorescence the isolated exosomes exhibited a well-defined vesicle
staining revealed that LPS elevated the expression configuration, characterized by a typical cup-like shape
of the M1-associated protein iNOS, whereas IL-4 with a diameter of approximately 100 nm. Utilizing NTA,
increased the expression of the M2-associated protein we observed that the majority of the isolated exosomes
Arg (Figure 1D and E). Collectively, these findings exhibited sizes within the range of 30 – 150 nm. Notably,
validate the successful induction of proinflammatory no extraneous peaks were detected in the particle
and anti-inflammatory phenotypes of microglia in vitro, distribution profiles, indicating a high level of uniformity
establishing a solid foundation for future experiments. in the exosome population (Figure 2B). These findings
A B
C D
E
Figure 1. Detrimental phenotype and protective phenotype microglia were successfully induced in vitro. The primary cultured microglia were treated
with lipopolysaccharide (100 ng/mL) and IL-4 (10 ng/mL) for 24 h, respectively. (A) Cell morphology (scale bar = 50 μm; magnification: ×40), (B and C)
Quantitative polymerase chain reaction, (D) Western blotting, and (E) immunofluorescence were used to assess the expression of M1 and M2 microglia
markers following the different treatments (scale bar = 100 μm; magnification: ×10). Notes: All data are presented as the mean ± standard deviation.
*P < 0.05 and **P < 0.01.
Volume 3 Issue 3 (2024) 5 doi: 10.36922/an.3166