
Page 91 - AN-4-1
P. 91
Advanced Neurology Tetrapleura tetraptera protects the hippocampus
Table 3. Seizure score differences on alternate day 11 between experimental groups after pentylenetetrazol administration
Groups PTZ PTZ+SV PTZ+TT (LD) PTZ+TT (ID) PTZ+TT (HD)
(n=7) (n=7) (n=7) (n=7) (n=7)
Seizure scores 4.29±1.60 3.50±1.76 1.20±0.84** 1.00±0.63*** b 3.25±0.96
Notes: One-way analysis of variance and Bonferroni’s post-hoc tests were performed. Values are expressed as mean±standard deviation. F=8.52,
p<0.001. **Indicates a significant difference from the PTZ group at p<0.01. ***Represents a significant difference from the PTZ group at p<0.001.
b Significantly different from the PTZ+SV group at p<0.05.
Abbreviations: HD: High dose; ID: Intermediate dose; LD: Low dose; PTZ: Pentylenetetrazol; SV: Sodium valproate; TT: Tetrapleura tetraptera.
Table 4. Quantal protection and mortality rate of the experimental groups after pentylenetetrazol administration
Groups Quantal protection Percentage protection (%) Mortality rate Percentage mortality (%)
PTZ (n=7) 4/7 57.14 3/7 42.86
PTZ+SV (n=7) 6/7 85.71 1/7 14.29
PTZ+TT (LD) (n=7) 5/7 71.42 2/7 28.58
PTZ+TT (ID) (n=7) 6/7 85.71 1/7 14.29
PTZ+TT (HD) (n=7) 4/7 57.14 3/7 42.86
Abbreviations: HD: High dose; ID: Intermediate dose; LD: Low dose; PTZ: Pentylenetetrazol; SV: Sodium valproate; TT: Tetrapleura tetraptera.
the test groups and the control group, or among the test
groups. However, the number of other cresyl violet-stained
cell types in the sodium valproate and intermediate-dose
T. tetraptera-pretreated groups was significantly lower
(p<0.05) compared to the control group (Figure 3).
3.7. Neuron-specific enolase immunoreactivity
Expression of NSE was observed in the hippocampal CA3
region of the control group (Figure 4A). The hippocampal
CA3 regions of the T. tetraptera-alone and the low-dose
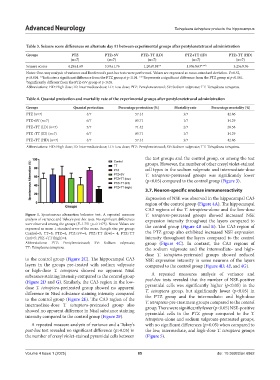
Figure 1. Spontaneous alternation behavior test. A repeated measure T. tetraptera-pretreated groups showed increased NSE
analysis of variance and Tukey’s post-hoc tests. No significant differences expression intensity throughout the layers compared to
were observed among the groups (F=1.751; p=0.1475). Notes: Values are
expressed as mean ± standard error of the mean. Sample size per group: the control group (Figure 4B and E). The CA3 region of
Control=5; TT=5; PTZ=4; PTZ+SV=4; PTZ+TT (low)= 4; PTZ+TT the PTZ group also exhibited increased NSE expression
(int)=5; PTZ +TT (high)=4. intensity throughout the layers compared to the control
Abbreviations: PTZ: Pentylenetetrazol; SV: Sodium valproate; group (Figure 4C). In contrast, the CA3 regions of
TT: Tetrapleura tetraptera. the sodium valproate and the intermediate- and high-
dose T. tetraptera-pretreated groups showed reduced
to the control group (Figure 2C). The hippocampal CA3 NSE expression intensity in some neurons of the layers
layers in the groups pre-treated with sodium valproate compared to the control group (Figure 4D, 4F, and 4G).
or high-dose T. tetraptera showed no apparent Nissl
substance staining intensity compared to the control group A repeated measures analysis of variance and
(Figure 2D and G). Similarly, the CA3 region in the low- post-hoc tests revealed that the number of NSE-positive
dose T. tetraptera-pretreated group showed no apparent pyramidal cells was significantly higher (p<0.05) in the
difference in Nissl substance staining intensity compared T. tetraptera group, but significantly lower (p<0.05) in
to the control group (Figure 2E). The CA3 region of the the PTZ group and the intermediate- and high-dose
intermediate-dose T. tetraptera-pretreated group also T. tetraptera-pre-treatment groups compared to the control
showed no apparent difference in Nissl substance staining group. There were significantly fewer (p<0.05) NSE-positive
pyramidal cells in the PTZ group compared to the T.
intensity compared to the control group (Figure 2F).
tetraptera-alone and sodium valproate-pretreated groups,
A repeated measure analysis of variance and a Tukey’s with no significant differences (p>0.05) when compared to
post-hoc test revealed no significant difference (p>0.05) in the low, intermediate, and high-dose T. tetraptera groups
the number of cresyl violet-stained pyramidal cells between (Figure 5).
Volume 4 Issue 1 (2025) 85 doi: 10.36922/an.6862