
Page 28 - ARNM-1-1
P. 28
Advances in Radiotherapy
& Nuclear Medicine Mathematic modeling of PDD for FF and FFF in photon
A A
B B
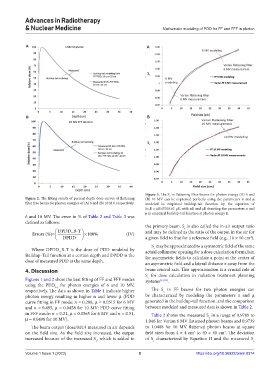
Figure 3. The S in flattening filter beams for photon energy (A) 6 and
c
Figure 2. The fitting results of percent depth dose curves of flattening (B) 10 MV can be expressed perfectly using the parameters n and μ
filter free beams for photon energies of (A) 6 and (B) 10 MV, respectively. modeled in empirical buildup-tail function by the equation of
Sc,E = nE•(FS)0.63 μE, with nE and μE denoting the parameters n and
μ in empirical buildup-tail function at photon energy E.
6 and 10 MV. The error in % of Table 2 and Table 3 was
defined as follows:
the primary beam. S is also called the in-air output ratio
c
DPDD_B-T and may be defined as the ratio of the output in the air for
Errors (%)= DPDD ×100% (IV) a given field to that for a reference field (e.g., 10 × 10 cm ).
2
S may be approximated to a symmetric field of the same
c
Where DPDD_B-T is the dose of PDD modeled by actual collimator opening for a dose calculation formalism
Buildup-Tail function at a certain depth and DPDD is the for asymmetric fields to calculate a point at the center of
dose of measured PDD at the same depth.
an asymmetric field and a lateral distance x away from the
4. Discussion beam central axis. This approximation is a crucial role of
S for dose calculation in radiation treatment planning
c
Figures 1 and 2 show the best fitting of FF and FFF modes systems [17,18] .
using the PDD for photon energies of 6 and 10 MV,
b-t
respectively. The data as shown in Table 1 indicate higher The S in FF beams for two photon energies can
c
photon energy resulting in higher n and lower μ (PDD be characterized by modeling the parameters n and μ
curve fitting in FF mode: n = 0.208, μ = 0.0515 for 6 MV generated in the buildup-tail function, and the comparison
and n = 0.495, μ = 0.0458 for 10 MV; PDD curve fitting between modeled and measured data is shown in Table 2.
in FFF mode: n = 0.21, μ = 0.0565 for 6 MV and n = 0.51, Table 2 shows the measured S in a range of 0.9709 to
c
μ = 0.0498 for 10 MV). 1.046 for Varian 6 MV flattened photon beams and 0.9739
The beam output (dose/MU) measured in air depends to 1.0408 for 10 MV flattened photon beams at square
2
2
on the field size. As the field size increased, the output field sizes from 4 × 4 cm to 40 × 40 cm . The deviation
increased because of the increased S , which is added to of S characterized by Equation II and the measured S
c
c
c
Volume 1 Issue 1 (2023) 5 https://doi.org/10.36922/arnm.0314