
Page 30 - ARNM-1-1
P. 30
Advances in Radiotherapy
& Nuclear Medicine Mathematic modeling of PDD for FF and FFF in photon
A by the parameters n and μ generated in the buildup-tail
function.
The comparison between modeled and measured S
c
of Varian in FFF beams for photon energies of 6 and 10
MV is shown in Table 3. Table 3 shows the measured S
c
in FFF beams at a range of 0.889 to 1.126 for Varian 6
MV photon energy and 0.926 to 1.064 for 10 MV photon
energy at square field sizes from 4 × 4 cm to 40 × 40 cm .
2
2
The deviation of Sc modeled by Equation III and measured
S was maximum at 1.12% for 6 MV and within 1.0% for
c
10 MV.
B Since parameter n represents the photon beam
hardening factor in the buildup function, in other words,
the larger n (n = 4.95), the higher beam quality. Therefore,
it was observed that the larger n, the less surface dose, and
the deeper d max (to compare n = 4.95 and n = 0.0495 in
Figure 5).
On the other hand, μ represents the attenuation
coefficient. Meanwhile, the tail function represents the
beam penetration ability of a high-energy photon beam.
As shown in Figure 5, the larger μ (μ = 0.458) is correlated
with more attenuation when the photon penetrates in
the medium; therefore, it was observed that the larger μ
is correlated to the steeper curves and a shorter range (to
compare μ = 0.458 and μ = 0.00458).
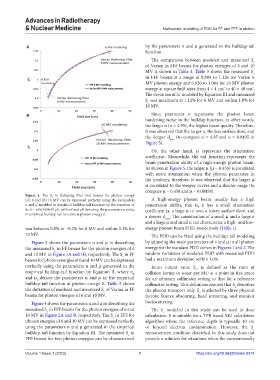
Figure 4. The S in flattening filter free beams for photon energy
c
(A) 6 and (B) 10 MV can be expressed perfectly using the parameters A high-energy photon beam usually has a high
n and μ modeled in empirical buildup-tail function by the equation of penetration ability, that is, it has a small attenuation
Sc,E = nE•(FS)4.45 μE, with nE and μE denoting the parameters n and μ coefficient μ, a large n to own a lower surface dose, and
in empirical buildup-tail function at photon energy E. a deeper d . The combination of a small μ and a large n
max
and a large μ and small n can characterize a high- and low-
was between 0.8% to −0.2% for 6 MV and within 0.1% for energy photon beam PDD, respectively (Table 1).
10 MV. The PDD can be fitted using the buildup-tail modeling
Figure 3 shows the parameters n and μ in describing by adjusting the main parameters of n and μ in all photon
the measured S in FF beams for the photon energies of 6 energy for the standard PDD curves in Figures 1 and 2. The
c
and 10 MV in Figure 1A and 1B, respectively. The S in FF random variations of modeled PDD with measured PDD
c
beams for photon energies of 6 and 10 MV can be expressed had a maximum deviation within 1.0%.
perfectly using the parameters n and μ generated in the In-air output ratio, S , is defined as the ratio of
c
empirical buildup-tail function by Equation II, where n collision kerma to water per MU at a point in free space
E
and μ denote the parameters n and μ in the empirical for an arbitrary collimator setting to that for a reference
E
buildup-tail function at photon energy E. Table 2 shows collimator setting. This definition ensures that S describes
c
the deviation of modeled and measured S of Varian in FF the photon transport only. S is affected by three physical
c
c
beams for photon energies of 6 and 10 MV. factors: Source obscuring, head scattering, and monitor
Figure 4 shows the parameters n and μ in describing the backscattering.
measured S in FFF beams for the photon energies of 6 and The S modeled in this study can be used in dose
c
c
10 MV in Figure 2A and B, respectively. The S in FFF for calculation. It is suitable for a TPR-based MU calculation
c
photon energies of 6 and 10 MV can be expressed perfectly algorithm where the reference depth is typically 10 cm
using the parameters n and μ generated in the empirical or beyond electron contamination. However, the S
c
buildup-tail function by Equation III. The measured S in measurement condition described in this study does not
c
FFF beams for two photon energies can be characterized provide a solution for situations when the conventionally
Volume 1 Issue 1 (2023) 7 https://doi.org/10.36922/arnm.0314