
Page 58 - ARNM-2-3
P. 58
Advances in Radiotherapy
& Nuclear Medicine NCRT for T3N0M0 ESCC
2.4. Follow-up was determined from the surgery date until the first sign of
During the treatment phase, patients were evaluated disease progression or the last known follow-up date. Actual
weekly. After completing treatment, they were monitored survival was calculated using the Kaplan–Meier method and
every 3 – 6 months for the 1 2 years, every 6 – 12 months compared using the log-rank test. Prognostic factors were
st
for the next 3 years, and annually thereafter. Recurrence was analyzed using univariate and multivariate Cox regression
classified as local recurrence, distant metastasis, or death analyses. To mitigate potential confounding factors between
due to other causes. Local recurrence was characterized the groups, propensity score matching (PSM) was also
performed to balance the uneven variables between the two
as the reappearance of cancer in the supraclavicular, patient cohorts. A 1:1 nearest neighbor matching algorithm
mediastinal, or peritoneal regions, while distant metastasis was applied using a caliper width of 0.02. The following
referred to the recurrence of cancer in other parts of the variables were selected to generate the propensity score: age,
body. All recurrences were confirmed through CT or sex, Karnofsky Performance Status (KPS), weight loss, tumor
magnetic resonance imaging scans, endoscopy, or positron location, tumor length, lymphovascular invasion (LVI),
emission tomography-CT examinations. Cytological or perineural invasion (PNI), and total LNs excised. A P < 0.05
histological examinations were conducted when necessary, was considered statistically significant. All analyses were
and the location and date of recurrence were documented.
performed using R Statistical Software (Version 4.2.2,
2.5. Statistical analysis http://www.R-project.org, The R Foundation).
Baseline characteristics of the study participants were 3. Results
compared using the Chi-squared test or Fisher’s exact test,
as appropriate. Overall survival (OS) was calculated from 3.1. Patient characteristics
the date of diagnosis to the occurrence of the event or the After applying the inclusion and exclusion criteria, the
last known follow-up date. Disease-free survival (DFS) records of 443 eligible patients treated between January
A B C
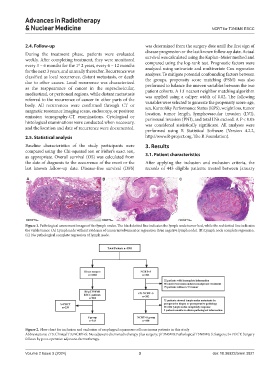
Figure 1. Pathological assessment images of the lymph nodes. The black dotted line indicates the lymph node tumor bed, while the red dotted line indicates
the viable tumor. (A) Lymph node without evidence of cancer involvement or regression (true negative lymph node). (B) Lymph node complete regression.
(C) No pathological complete regression of lymph node.
Figure 2. Flow chart for inclusion and exclusion of esophageal squamous cell carcinoma patients in this study
Abbreviations: cT3: Clinical T3; NCRT+S: Neoadjuvant chemoradiotherapy plus surgery; pT3N0M0: Pathological T3N0M0; S: Surgery; S+POCT: Surgery
follows by post-operative adjuvant chemotherapy.
Volume 2 Issue 3 (2024) 3 doi: 10.36922/arnm.3821