
Page 60 - ARNM-2-3
P. 60
Advances in Radiotherapy
& Nuclear Medicine NCRT for T3N0M0 ESCC
CI = 0.52 – 0.91; P = 0.008) and the implementation of Consistent results were observed in the matched
NCRT + S (NCRT + S vs. surgery; HR = 0.56; 95% CI = 0.37 populations. Relative to the surgery group (3-year
– 0.85; P = 0.004) were significantly correlated with better OS = 65.3%; 5-year OS = 50.3%), the NCRT + S
OS. The results of the multivariate analysis indicated that age group showed significantly better OS outcomes
(P = 0.013), KPS (P < 0.001), total LNs excised (P = 0.003), (3-year OS = 72.1%; 5-year OS = 68.6%; HR = 0.613,
and NCRT + S (P = 0.005) were independent prognostic 95% CI = 0.383 – 0.981; P = 0.04; Figure 3C). In
factors for OS (Table 2). Similarly, analysis of the sample contrast to the surgery group (3-year DFS = 58.2%;
after PSM revealed that age (P = 0.009), the total number of 5-year DFS = 45.9%), the NCRT + S group did
LNs excised (P = 0.004), and NCRT + S status (P = 0.028) not show a statistically significant improvement
were independent prognostic factors affecting OS (Table A1 in DFS (3-year DFS = 61.9%; 5-year DFS = 58.1%;
in Appendix). HR = 0.830, 95% CI 0.537 – 1.283; P = 0.39; Figure 3D).
3.3. Survival 3.4. Subgroup analysis
The median survival time for all patients was 80.8 months Subgroup analyses were conducted to identify which
(range = 0.2 – 156.6 months). The overall study subgroups could achieve survival benefits from NCRT +
cohort’s 5-year OS and DFS rates were 56% and 50.2%, S. The NCRT + S group was divided into pCR and non-
respectively. The NCRT + S group (3-year OS = 74.7%; pCR groups, and their survival rates were compared to
5-year OS = 69.7%; HR = 0.572, 95% CI = 0.407 – 0.804; the surgery group. Patients in the pCR group showed
P = 0.0059) had significantly better OS than the surgery a significant improvement in OS compared to surgery
group (3-year OS = 64.5%; 5-year OS = 52.9%) in the alone (HR = 0.522, 95% CI = 0.339 – 0.804; P = 0.019,
overall population (Figure 3A). While the NCRT + S group Figure 3E). In contrast, the non-pCR group did not
(3-year DFS = 64.2%; 5-year DFS = 60.6%) demonstrated show any significant OS benefits (P = 0.093, Figure 3E).
higher DFS than the surgery group (3-year DFS = 58.4%; Although the DFS of patients in the pCR group was longer
5-year DFS = 48.2%), the difference was not statistically than those who only underwent surgery, the difference was
significant (HR = 0.784, 95% CI = 0.564 – 1.09; P = 0.17; not statistically significant (P = 0.054, Figure 3F). Similarly,
Figure 3B). the non-pCR group did not show any significant benefit
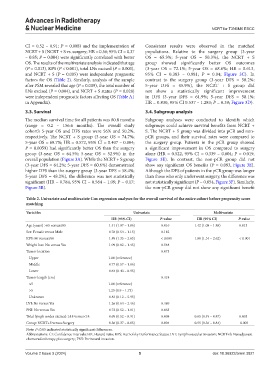
Table 2. Univariate and multivariate Cox regression analyses for the overall survival of the entire cohort before propensity score
matching
Variables Univariate Multivariate
HR (95% CI) P‑value HR (95% CI) P‑value
Age (years) >65 versus≤65 1.41 (1.07 – 1.86) 0.016 1.42 (1.08 – 1.88) 0.013
Sex: Female versus Male 0.78 (0.54 – 1.13) 0.182
KPS: 80 versus≥90 1.89 (1.35 – 2.63) < 0.001 1.88 (1.34 – 2.62) < 0.001
Weight loss: No versus Yes 1.09 (0.82 – 1.45) 0.548
Tumor location 0.073
Upper 1.00 (reference)
Middle 0.77 (0.57 – 1.06)
Lower 0.64 (0.43 – 0.95)
Tumor length (cm) 0.418
≤5 1.00 (reference)
>5 1.25 (0.9 – 1.73)
Unknown 0.83 (0.12 – 5.93)
LVI: No versus Yes 1.26 (0.64 – 2.46) 0.486
PNI: No versus Yes 0.72 (0.52 – 1.01) 0.063
Total lymph nodes excised: ≥18 versus<18 0.69 (0.52 – 0.91) 0.008 0.65 (0.49 – 0.87) 0.003
Group: NCRT+S versus Surgery 0.56 (0.37 – 0.85) 0.004 0.55 (0.36 – 0.84) 0.005
Note: P<0.05 indicated statistically significant differences.
Abbreviations: CI: Confidence intervals; HR: Hazard ratio; KPS: Karnofsky Performance Status; LVI: Lymphovascular invasion; NCRT+S: Neoadjuvant
chemoradiotherapy plus surgery; PNI: Perineural invasion.
Volume 2 Issue 3 (2024) 5 doi: 10.36922/arnm.3821