
Page 59 - ARNM-2-3
P. 59
Advances in Radiotherapy
& Nuclear Medicine NCRT for T3N0M0 ESCC
2008 and June 2021 were retrospectively reviewed. Of these, 3.2. Univariate and multivariate analyses before and
343 patients were classified as pT3N0M0 and underwent after PSM
surgery alone, while 100 patients with pre-T3N0M0 In the univariate Cox regression analysis conducted on the
status received NCRT before surgery (Figure 2). The entire population, age (>65 vs. ≤65, Hazard ratio [HR] = 1.41;
clinicopathological characteristics of the total population 95% Confidence interval [CI] = 1.07 – 1.86, P = 0.016) and
and the matched population are presented in Table 1. After a KPS score of 80 (80 vs. ≥90; HR = 1.89; 95% CI = 1.35 –
PSM, baseline information was balanced between the two 2.63; P < 0.001) were associated with poorer OS. Conversely,
groups. total number of LNs excised (≥18 vs. <18; HR = 0.69; 95%
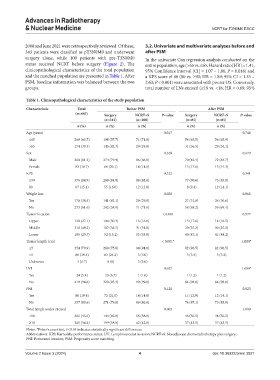
Table 1. Clinicopathological characteristics of the study population
Characteristic Total Before PSM After PSM
(n=443) Surgery NCRT+S P‑value Surgery NCRT+S P‑value
(n=343) (n=100) (n=85) (n=85)
n (%) n (%) n (%) n (%) n (%)
Age (years) 0.017 0.748
≤65 269 (60.7) 198 (57.7) 71 (71.0) 54 (63.5) 56 (65.9)
>65 174 (39.3) 145 (42.3) 29 (29.0) 31 (36.5) 29 (34.1)
Sex 0.168 0.679
Male 360 (81.3) 274 (79.9) 86 (86.0) 70 (82.4) 72 (84.7)
Female 83 (18.7) 69 (20.1) 14 (14.0) 15 (17.6) 13 (15.3)
KPS 0.322 0.341
≥90 376 (84.9) 288 (84.0) 88 (88.0) 77 (90.6) 73 (85.9)
80 67 (15.1) 55 (16.0) 12 (12.0) 8 (9.4) 12 (14.1)
Weight loss 0.028 0.868
Yes 170 (38.4) 141 (41.1) 29 (29.0) 27 (31.8) 26 (30.6)
No 273 (61.6) 202 (58.9) 71 (71.0) 58 (68.2) 59 (69.4)
Tumor location < 0.001 0.977
Upper 120 (27.1) 104 (30.3) 16 (16.0) 15 (17.6) 14 (16.5)
Middle 218 (49.2) 187 (54.5) 31 (31.0) 30 (35.3) 30 (35.3)
Lower 105 (23.7) 52 (15.2) 53 (53.0) 40 (47.1) 41 (48.2)
Tumor length (cm) < 0.001* 1.000*
≤5 354 (79.9) 260 (75.8) 94 (94.0) 82 (96.5) 82 (96.5)
>5 86 (19.4) 83 (24.2) 3 (3.0) 3 (3.5) 3 (3.5)
Unknown 3 (0.7) 0 (0) 3 (3.0)
LVI 0.027 1.000*
Yes 24 (5.4) 23 (6.7) 1 (1.0) 1 (1.2) 1 (1.2)
No 419 (94.6) 320 (93.3) 99 (99.0) 84 (98.8) 84 (98.8)
PNI 0.120 0.823
Yes 86 (19.4) 72 (21.0) 14 (14.0) 11 (12.9) 12 (14.1)
No 357 (80.6) 271 (79.0) 86 (86.0) 74 (87.1) 73 (85.9)
Total lymph nodes excised 0.005 1.000
<18 202 (45.6) 144 (42.0) 58 (58.0) 48 (56.5) 48 (56.5)
≥18 241 (54.4) 199 (58.0) 42 (42.0) 37 (43.5) 37 (43.5)
Notes: *Fisher’s exact test; P<0.05 indicates statistically significant differences.
Abbreviations: KPS: Karnofsky performance status; LVI: Lymphovascular invasion; NCRT+S: Neoadjuvant chemoradiotherapy plus surgery;
PNI: Perineural invasion; PSM: Propensity score matching.
Volume 2 Issue 3 (2024) 4 doi: 10.36922/arnm.3821