
Page 72 - ARNM-2-3
P. 72
Advances in Radiotherapy
& Nuclear Medicine Association between PET-derived flows and angiography
Table 1. Baseline patient characteristics (n=189) A
Variables Value (%)
Gender (n[%])
Female 82 (43)
Male 107 (56.6)
Age (Median [IQR], year) 66 (56,74)
BMI 34.5
Race (n[%])
Black/African American 38 (20.1)
B
White/Caucasian 130 (68.8)
Hispanic/Latino 15 (7.9)
Other 6 (3.1)
Hypertension (n[%]) 145 (77.5)
Diabetes (n[%]) 87 (46.5)
Hyperlipidemia (n[%]) 126 (67.4)
Smoking (n[%]) 38 (20.3)
Chronic renal disease (n[%]) 25 (13.4)
Peripheral vascular disease (n[%]) 16 (8.6)
Family history of CAD (n[%]) 22 (11.8) C
Abbreviations: BMI: Body mass index; CAD: Coronary artery disease;
IQR: Interquartile range.
Table 2. Characteristics of stenosis in each vessel on
quantitative coronary angiography in the full sample
Vessels Obstruction Obstruction Stenosis percent (%)
diameter (mm) length (mm)
LAD 1.60 (1.21, 1.93) 7.71 (5.13, 11.33) 29.81 (24.61, 45.00)
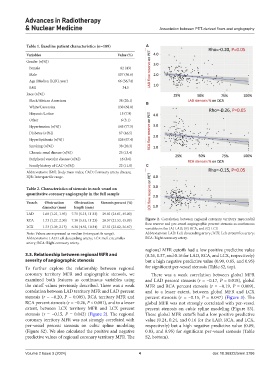
RCA 1.73 (1.27, 2.30) 7.38 (5.45, 11.23) 28.57 (21.53, 45.09) Figure 2. Correlation between regional coronary territory myocardial
flow reserve and per-vessel angiographic percent stenosis as continuous
LCX 1.73 (1.39, 2.15) 6.30 (4.55, 10.34) 27.51 (23.02, 36.67) variables in the (A) LAD, (B) RCA, and (C) LCX
Note: Values are expressed as median (interquartile range). Abbreviations: LAD: Left descending artery; LCX: Left circumflex artery;
Abbreviations: LAD: Left descending artery; LCX: Left circumflex RCA: Right coronary artery.
artery; RCA: Right coronary artery.
regional MFR cutoffs had a low positive predictive value
3.3. Relationship between regional MFR and (0.26, 0.37, and 0.16 for LAD, RCA, and LCX, respectively)
severity of angiographic stenosis but a high negative predictive value (0.90, 0.85, and 0.95)
To further explore the relationship between regional for significant per-vessel stenosis (Table S2, top).
coronary territory MFR and angiographic stenosis, we There was a weak correlation between global MFR
examined both features as continuous variables using and LAD percent stenosis (r = −0.17, P = 0.018), global
the cutoff values previously described. There was a weak MFR and RCA percent stenosis (r = −0.19, P = 0.009),
correlation between LAD territory MFR and LAD percent and to a lesser extent, between global MFR and LCX
stenosis (r = −0.20, P = 0.005), RCA territory MFR and percent stenosis (r = −0.15, P = 0.047) (Figure 3). The
RCA percent stenosis (r = −0.26, P < 0.001), and to a lesser global MFR was not strongly correlated with per-vessel
extent, between LCX territory MFR and LCX percent percent stenosis on cubic spline modeling (Figure S3).
stenosis (r = −0.15, P = 0.042) (Figure 2). The regional These global MFR cutoffs had a low positive predictive
coronary territory MFR was not strongly correlated with value (0.24, 0.24, and 0.16 for the LAD, RCA, and LCX,
per-vessel percent stenosis on cubic spline modeling respectively) but a high negative predictive value (0.89,
(Figure S2). We also calculated the positive and negative 0.83, and 0.95) for significant per-vessel stenosis (Table
predictive values of regional coronary territory MFR. The S2, bottom).
Volume 2 Issue 3 (2024) 4 doi: 10.36922/arnm.3786