
Page 44 - ARNM-2-4
P. 44
Advances in Radiotherapy
& Nuclear Medicine Outcomes of durations in 2D and 3D BT for CCA
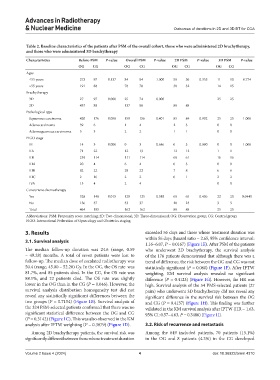
Table 2. Baseline characteristics of the patients after PSM of the overall cohort, those who were administered 2D brachytherapy,
and those who were administered 3D brachytherapy
Characteristics Before‑PSM P‑value Overall PSM P‑value 2D PSM P‑value 3D PSM P‑value
OG CG OG CG OG CG OG CG
Ages
≤55 years 273 97 0.137 84 84 1.000 50 56 0.355 11 10 0.774
>55 years 191 88 78 78 38 32 14 15
Brachytherapy
3D 27 97 0.000 25 74 0.000 - 25 25 -
2D 437 88 137 88 88 88
Pathological type
Squamous carcinoma 420 176 0.058 159 156 0.401 85 84 0.902 25 25 1.000
Adenocarcinoma 39 6 1 4 2 3 0 0
Adenosquamous carcinoma 5 3 2 2 1 1 0 0
FIGO stage
IB 14 3 0.000 0 3 0.646 0 3 0.090 0 0 1.000
IIA 71 22 12 13 12 12 1 1
IIB 259 114 111 114 60 61 16 16
IIIA 20 4 6 4 0 3 0 0
IIIB 82 22 29 22 7 8 6 6
IIIC 2 16 2 2 0 1 2 2
IVA 15 4 2 4 0 0
Concurrent chemotherapy
Yes 328 148 0.015 129 125 0.589 60 65 0.406 22 20 0.0440
No 136 37 33 37 28 23 3 5
Total 464 185 162 162 88 88 25 25
Abbreviations: PSM: Propensity score matching; 2D: Two-dimensional; 3D: Three-dimensional; OG: Observation group; CG: Control group;
FIGO: International Federation of Gynecology and Obstetrics staging.
3. Results exceeded 56 days and those whose treatment duration was
within 56 days (hazard ratio = 2.65, 95% confidence interval:
3.1. Survival analysis
1.16−6.07, P = 0.0167) (Figure 1E). After PSM of the patients
The median follow-up duration was 24.6 (range, 0.59 who underwent 2D brachytherapy, the survival analysis
– 49.28) months. A total of seven patients were lost to of the 176 patients demonstrated that although there was a
follow-up. The median dose of escalated radiotherapy was trend of difference, the risk between the OG and CG was not
50.4 (range, 45.00 – 52.20) Gy. In the OG, the OS rate was statistically significant (P = 0.080) (Figure 1F). After IPTW
81.7%, and 85 patients died. In the CG, the OS rate was weighting, KM survival analysis revealed no significant
88.1%, and 22 patients died. The OS rate was slightly difference (P = 0.4123) (Figure 1G). However, the HR was
lower in the OG than in the CG (P = 0.046). However, the high. Survival analysis of the 54 PMS-selected patients (27
survival analysis distribution homogeneity test did not pairs) who underwent 3D brachytherapy did not reveal any
reveal any statistically significant differences between the significant difference in the survival risk between the OG
two groups (P = 0.7154) (Figure 1B). Survival analysis of and CG (P = 0.4137) (Figure 1H). This finding was further
the 324 PSM-selected patients confirmed that there was no validated in the KM survival analysis after IPTW (HR = 1.63,
significant statistical difference between the OG and CG 95% CI: 0.57−4.63, P = 0.3486) (Figure 1I).
(P = 0.3142) (Figure 1C). This was also observed in the KM
analysis after IPTW weighting (P = 0.3079) (Figure 1D). 3.2. Risk of recurrence and metastasis
Among 2D brachytherapy patients, the survival risk was Among the 649 included patients, 70 patients (15.1%)
significantly different between those whose treatment duration in the OG and 8 patients (4.3%) in the CG developed
Volume 2 Issue 4 (2024) 4 doi: 10.36922/arnm.4310