
Page 46 - ARNM-2-4
P. 46
Advances in Radiotherapy
& Nuclear Medicine Outcomes of durations in 2D and 3D BT for CCA
A B C
D E F
G H I
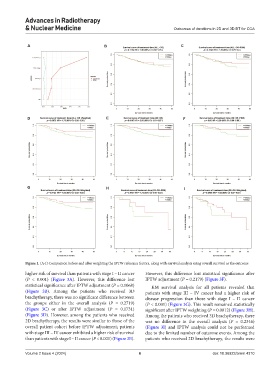
Figure 1. (A-I) Comparison before and after weighting the IPTW reference factors, along with survival analysis using overall survival as the outcome
higher risk of survival than patients with stage I – II cancer However, this difference lost statistical significance after
(P < 0.001) (Figure 3A). However, this difference lost IPTW adjustment (P = 0.2179) (Figure 3F).
statistical significance after IPTW adjustment (P = 0.1068) KM survival analysis for all patients revealed that
(Figure 3B). Among the patients who received 3D patients with stage III – IV cancer had a higher risk of
brachytherapy, there was no significant difference between disease progression than those with stage I – II cancer
the groups either in the overall analysis (P = 0.2719) (P < 0.001) (Figure 3G). This result remained statistically
(Figure 3C) or after IPTW adjustment (P = 0.1731) significant after IPTW weighting (P = 0.0012) (Figure 3H).
(Figure 3D). However, among the patients who received Among the patients who received 3D brachytherapy, there
2D brachytherapy, the results were similar to those of the was no difference in the overall analysis (P = 0.2346)
overall patient cohort before IPTW adjustment; patients (Figure 3I) and IPTW analysis could not be performed
with stage III – IV cancer exhibited a higher risk of survival due to the limited number of outcome events. Among the
than patients with stage I – II cancer (P < 0.001) (Figure 3E). patients who received 2D brachytherapy, the results were
Volume 2 Issue 4 (2024) 6 doi: 10.36922/arnm.4310