
Page 45 - ARNM-2-4
P. 45
Advances in Radiotherapy
& Nuclear Medicine Outcomes of durations in 2D and 3D BT for CCA
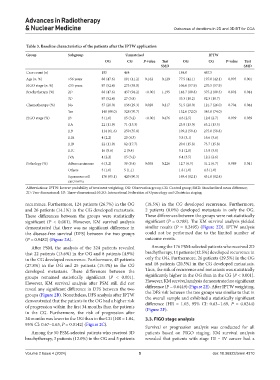
Table 3. Baseline characteristics of the patients after the IPTW application
Group Subgroup Unmatched IPTW
OG CG P‑value Test OG CG P‑value Test
SMD SMD
Case count (n) 185 464 184.0 467.5
Age (n, %) >56 years 88 (47.6) 191 (41.2) 0.162 0.129 77.5 (42.1) 197.0 (42.1) 0.995 0.001
FIGO stage (n, %) ≤55 years 97 (52.4) 273 (58.8) 106.6 (57.9) 270.5 (57.9)
Brachytherapy (%) 2D 88 (47.6) 437 (94.2) <0.001 1.195 148.7 (80.8) 375.2 (80.3) 0.892 0.014
3D 97 (52.4) 27 (5.8) 35.3 (19.2) 92.3 (19.7)
Chemotherapy (%) No 37 (20.0) 136 (29.3) 0.020 0.217 51.5 (28.0) 121.7 (26.0) 0.704 0.044
Yes 148 (80.0) 328 (70.7) 132.6 (72.0) 345.8 (74.0)
FIGO stage (%) IB 3 (1.6) 15 (3.2) <0.001 0.476 4.6 (2.5) 12.8 (2.7) 0.999 0.059
IIA 22 (11.9) 71 (15.3) 23.9 (13.0) 63.2 (13.5)
IIB 114 (61.6) 259 (55.8) 109.2 (59.4) 275.0 (58.8)
IIIA 4 (2.2) 20 (4.3) 5.8 (3.1) 16.6 (3.6)
IIIB 22 (11.9) 82 (17.7) 29.0 (15.8) 73.7 (15.8)
IIIC 16 (8.6) 2 (0.4) 5.1 (2.8) 13.9 (3.0)
IVA 4 (2.2) 15 (3.2) 6.4 (3.5) 12.2 (2.6)
Pathology (%) Adenocarcinoma 6 (3.2) 39 (8.4) 0.058 0.226 12.7 (6.9) 31.2 (6.7) 0.989 0.011
Others 3 (1.6) 5 (1.1) 1.8 (1.0) 4.5 (1.0)
Squamous cell 176 (95.1) 420 (90.5) 169.4 (92.1) 431.8 (92.4)
carcinoma
Abbreviations: IPTW: Inverse probability of treatment weighting; OG: Observation group; CG: Control group; SMD: Standardized mean difference;
2D: Two-dimensional; 3D: Three-dimensional; FIGO: International Federation of Gynecology and Obstetrics staging.
recurrence. Furthermore, 124 patients (26.7%) in the OG (18.5%) in the CG developed recurrence. Furthermore,
and 26 patients (14.1%) in the CG developed metastasis. 2 patients (8.0%) developed metastasis in only the OG.
These differences between the groups were statistically These differences between the groups were not statistically
significant (P < 0.001). However, KM survival analysis significant (P = 0.788). The KM survival analysis yielded
demonstrated that there was no significant difference in similar results (P = 0.2495) (Figure 2D). IPTW analysis
the disease-free survival (DFS) between the two groups could not be performed due to the limited number of
(P = 0.9482) (Figure 2A). outcome events.
After PSM, the analysis of the 324 patients revealed Among the 176 PSM-selected patients who received 2D
that 22 patients (13.6%) in the OG and 8 patients (4.9%) brachytherapy, 11 patients (12.5%) developed recurrence in
in the CG developed recurrence. Furthermore, 45 patients only the OG. Furthermore, 26 patients (29.5%) in the OG
(27.8%) in the OG and 25 patients (15.4%) in the CG and 18 patients (20.5%) in the CG developed metastasis.
developed metastasis. These differences between the Thus, the risk of recurrence and metastasis was statistically
groups remained statistically significant (P < 0.001). significantly higher in the OG than in the CG (P < 0.001).
However, KM survival analysis after PSM still did not However, KM survival analysis demonstrated no significant
reveal any significant difference in DFS between the two difference (P = 0.6449) (Figure 2E). After IPTW weighting,
groups (Figure 2B). Nonetheless, DFS analysis after IPTW the DFS risk between the two groups was similar to that in
demonstrated that the patients in the OG had a higher risk the overall sample and exhibited a statistically significant
difference (HR = 1.03, 95% CI: 0.63−1.69, P = 0.0244)
of progression within the first 34 months than the patients (Figure 2F).
in the CG. Furthermore, the risk of progression after
34 months was lower in the OG than in the CG (HR = 1.04, 3.3. FIGO stage analysis
95% CI: 0.67−1.63, P = 0.0142) (Figure 2C).
Survival or progression analysis was conducted for all
Among the 50 PSM-selected patients who received 3D patients based on FIGO staging. KM survival analysis
brachytherapy, 3 patients (12.0%) in the OG and 5 patients revealed that patients with stage III – IV cancer had a
Volume 2 Issue 4 (2024) 5 doi: 10.36922/arnm.4310