


Page 55 - ARNM-3-3
P. 55
Advances in Radiotherapy
            & Nuclear Medicine                                                 LuPSMA response patterns on PSMA PET


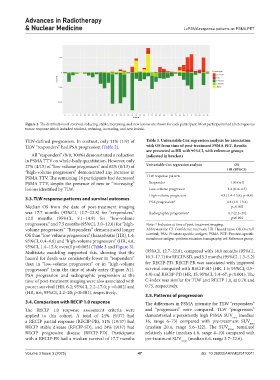
            Figure 2. The distributions of resolved, reducing, stable, increasing, and new lesions are shown for each participant. Most participants had a heterogenous
            tumor response which included resolved, reducing, increasing, and new lesions.

            TLW-defined progression. In contrast, only 11% (1/9) of   Table 3. Univariable Cox regression analysis for association
            TLW “responders” had PSA progression (Table 2).    with OS from time of post‑treatment PSMA PET. Results
                                                               are presented as HR with 95%CI, with reference groups
              All “responders” (9/9, 100%) demonstrated a reduction   indicated in brackets
            in PSMA TTV on whole-body quantitation. However, only
                                                                                                     OS
            27% (4/15) of “low-volume progressors” and 62% (8/13) of   Univariable Cox regression analysis  HR (95%CI)
            “high-volume progressors” demonstrated any increase in
            PSMA TTV. The remaining 16 participants had decreased   TLW response pattern
            PSMA TTV, despite the presence of new or “increasing”   Responder                      1.00 (ref)
            lesions identified by TLW.                          Low-volume progressor             1.4 (0.4–4.5)
                                                                High-volume progressor         4.8 (1.4–15.8), p=0.01
            3.3. TLW response patterns and survival outcomes
                                                                PSA progression*                  4.8 (1.8–13.4)
            Median OS from the date of post-treatment imaging                                      p=0.002
            was 17.7  months (95%CI, 12.7–22.8) for “responders,”   Radiographic progression*     6.7 (2.2–20)
            12.0  months  (95%CI,  9.1–14.9)  for  “low-volume                                     p≤0.001
            progressors,” and 7.5 months (95%CI, 3.0–12.0) for “high-  Note: * Indicates at time of post-treatment imaging.
            volume progressors.” “Responders” demonstrated longer   Abbreviations: CI: Confidence intervals; HR: Hazard ratio; OS: Overall
            OS than “low-volume progressors” (hazard ratio [HR], 1.4;   survival; PSA: Prostate-specific antigen; PSMA PET: Prostate-specific
            95%CI, 0.4–4.6) and “high-volume progressors” (HR, 4.8;   membrane antigen-positron emission tomography; ref: Reference group.
            95%CI, 1.4–15.8; overall p=0.005) (Table 3 and Figure 3).
            Multistate modeling supported this, showing that the   (95%CI, 12.7–22.8), compared with 14.0 months (95%CI,
            hazard for death was consistently lower in “responders”   10.3–17.7) for RECIP-SD, and 3.3 months (95%CI, 1.3–5.2)
            than in “low-volume progressors” or in “high-volume   for RECIP-PD. RECIP-PR was associated with improved
            progressors” from the time of study entry (Figure A1).   survival compared with RECIP-SD (HR, 1.5; 95%CI, 0.5–
            PSA progression and radiographic progression at the   4.8) and RECIP-PD (HR, 15; 95%CI, 3.4–67; p<0.001). The
            time of post-treatment imaging were also associated with   C-index was similar for TLW and RECIP 1.0, at 0.70 and
            poorer survival (HR, 6.2; 95%CI, 2.2–17.0; p =0.002) and   0.75, respectively.
            (HR, 6.6; 95%CI, 2.2–20; p<0.001), respectively.
                                                               3.5. Patterns of progression
            3.4. Comparison with RECIP 1.0 response            The differences in PSMA intensity for TLW “responders”

            The  RECIP  1.0 response  assessment  criteria were   and “progressors” were compared. TLW “progressors”
            applied  to  this  cohort.  A  total  of  24%  (9/37)  had   demonstrated a persistently high PSMA SUV  (median
                                                                                                    max
            a RECIP partial response (RECIP-PR), 51% (19/37) had   16, range 6–73) compared with pre-treatment SUV max
            RECIP stable disease (RECIP-SD), and 24% (9/37) had   (median 20.4,  range  5.6–122).  The  SUV mean   remained
            RECIP  progressive disease (RECIP-PD). Participants   relatively stable (median 4.8, range 4–10) compared with
            with a RECIP-PR had a median survival of 17.7 months   pre-treatment SUV mean  (median 6.6, range 3.7–22.6).


            Volume 3 Issue 3 (2025)                         47                         doi: 10.36922/ARNM025110011

