


Page 53 - ARNM-3-3
P. 53
Advances in Radiotherapy
            & Nuclear Medicine                                                 LuPSMA response patterns on PSMA PET


            not attributable to the tumor. Remaining lesions were   in  SUV ,  individual  lesion  volume,  and  TTV  on  both
                                                                     max
            combined into a single total tumor burden contour, from   68 Ga-PSMA and piflufolastat F-18 PET. 8,11,12
            which the total tumor volume (TTV), SUV , mean SUV   Following TLW analysis, each patient’s overall response
                                              max
            (SUV mean ), and total lesional activity were calculated.  was categorized as follows: “Responder,” when no lesions
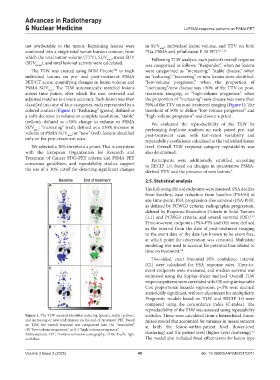
              The TLW was created using MIM Encore  to track   were categorized as “increasing;” “stable disease,” when
                                                 TM
            individual lesions on pre-  and post-treatment PSMA   no “reducing,” “increasing” or new lesions were identified;
            PET/CT scans, quantifying changes in lesion volume and   “low-volume progressor,” when the proportion of
            PSMA SUV . The TLW automatically matched lesions   “increasing”/new disease was <50% of the TTV on post-
                     max
            across time points, after which the user reviewed and   treatment imaging; or “high-volume progressor,” when
            adjusted matches to ensure accuracy. Each lesion was then   the proportion of “increasing”/new disease was more than
            classified into one of four categories, each represented by a   50% of the TTV on post-treatment imaging (Figure 1). The
            colored contour (Figure 1): “Reducing” (green), defined as   threshold of 50% to define “low-volume progressor” and
            a ≥sf% decrease in volume or complete resolution; “stable”   “high-volume progressor” was chosen a priori.
            (yellow), defined as <30% change in volume or PSMA   We evaluated the reproducibility of the TLW by
            SUV ; “increasing” (red), defined as a ≥30% increase in   performing duplicate analyses on each paired pre-  and
               max
            volume or PSMA SUV ; or “new” (red), lesions identified   post-treatment scan, with test–retest variability and
                              max
            only on the post-treatment scan.                   repeatability coefficients calculated at the individual lesion
              We selected a 30% threshold a priori. This is consistent   level. Overall TLW response category repeatability was
            with the European Organization for Research and    also determined.
            Treatment of Cancer FDG-PET criteria and PSMA PET    Participants were additionally stratified according
            consensus  guidelines,  and  repeatability  studies  support   to RECIP 1.0, based on changes in quantitative PSMA-
            the use of a 30% cutoff for detecting significant changes   derived TTV and the presence of new lesions. 4

                                                               2.5. Statistical analysis
                      A
                                                               The following clinical endpoints were assessed: PSA decline
                                                               from  baseline;  ≥ase  reduction  from  baseline  (PSA50)  at
                                                               any time-point; PSA progression-free survival (PSA-PFS),
                                                               as defined by PCWG3 criteria; radiographic progression,
                                                               defined by Response Evaluation Criteria in Solid Tumors
                                                               (1.1) and PCWG3 criteria; and overall survival (OS).
                                                                                                           9,13
                                                               Time-to-event endpoints (PSA-PFS and OS) were defined
                      B                                        as the interval from the date of post-treatment imaging
                                                               to the event date or the date last known to be event free,
                                                               at which point the observation was censored. Multistate
                                                               modeling was used to account for potential bias related to
                                                               time on treatment. 14
                                                                 Two-sided, exact binomial 95% confidence interval
                                                               (CI) were calculated for PSA response rates. Time-to-
                      C
                                                               event endpoints were measured, and median survival was
                                                               estimated using the Kaplan–Meier method. Overall TLW
                                                               response patterns were correlated with OS using univariable
                                                               Cox proportional hazards regression. p<5% were deemed
                                                               statistically significant, without adjustment for multiplicity.
                                                               Prognostic models based on TLW and RECIP 1.0 were
                                                               compared  using the  concordance index (C-index). The
                                                               reproducibility of the TLW was assessed using repeatability
            Figure 1. The TLW analysis identifies reducing (green), stable (yellow),   statistics. These were calculated from a hierarchical, linear,
            and increasing or new (red) lesions on the end-of-treatment PET. Based   mixed model that accounted for variance in measurements
            on TLW, the overall response was categorized into (A) “responder,”   at both the lesion-within-patient level (lower-level
            (B) “low-volume progressor,” or (C) “high-volume progressor.”                                   15
            Abbreviations: PET: Positron emission tomography; TLW: Traffic light   clustering) and the patient level (higher-level clustering).
            workflow.                                          The model also included fixed effect terms for lesion type


            Volume 3 Issue 3 (2025)                         45                         doi: 10.36922/ARNM025110011

