


Page 54 - ARNM-3-3
P. 54
Advances in Radiotherapy
            & Nuclear Medicine                                                 LuPSMA response patterns on PSMA PET


            (increased, reduced, resolved, and stable) and time point   criteria. Conventional post-treatment imaging (CT and
            (baseline and post-treatment). Ninety-five percent CI for   bone scintigraphy) was available for 92% (34/37), of whom
            the repeatability statistics were derived by bootstrapping.   18% (6/37) demonstrated radiographic progression.
            Analyses were performed using R, version 4.0.5. 16
                                                               3.2. Analysis of PSMA PET using the TLW
            3. Results                                         We  have  previously  reported  the  results  of  whole-body

            3.1. Patient characteristics                       quantitative analysis of pre- and post-treatment PSMA and
                                                               FDG PET in the LuPIN study. 17
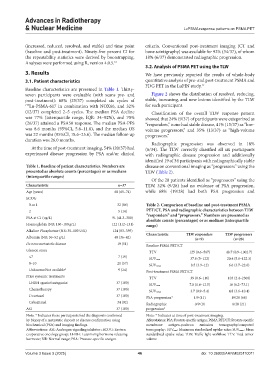
            Baseline characteristics are presented in Table 1. Thirty-
            seven  participants  were  evaluable  (with  scans  pre-  and   Figure 2 shows the distribution of resolved, reducing,
            post-treatment): 68% (25/37) completed six cycles of   stable, increasing, and new lesions identified by the TLW
            177 Lu-PSMA-617 in combination with NOX66, and 32%   for each participant.
            (12/37) completed 2–5  cycles. The median PSA decline   Classification of the overall TLW response pattern
            was 77% (interquartile range, IQR: 34–92%), and 70%   showed that 24% (9/37) of participants were categorized as
            (26/37) attained a PSA50 response. The median PSA-PFS   “responders,” none had stable disease, 41% (15/37) as “low-
            was  8.6  months  (95%CI,  5.6–11.6),  and  the  median  OS   volume progressors,” and 35% (13/37) as “high-volume
            was 22 months (95%CI, 18.6–25.6). The median follow-up   progressors.”
            duration was 26.0 months.
                                                                 Radiographic  progression  was  observed  in  18%
              At the time of post-treatment imaging, 54% (20/37) had   (6/34).  The  TLW  correctly  classified  all  six  participants
            experienced disease progression by PSA and/or clinical   with  radiographic  disease  progression  and  additionally
                                                               identified 19 of 34 participants with radiographically stable
            Table 1. Baseline of patient characteristics. Numbers are   disease on conventional imaging as “progressors” using the
            presented as absolute counts (percentages) or as medians   TLW (Table 2).
            (interquartile ranges)
                                                                 Of the 28 patients identified as “progressors” using the
            Characteristic                         n=37        TLW,  32%  (9/28)  had  no evidence  of  PSA  progression,
            Age (years)                           68 (65–74)   while 68% (19/28) had both PSA progression and
            ECOG
             0 or 1                                32 (86)     Table 2. Comparison of baseline and post‑treatment PSMA
             2                                     5 (14)      PET/CT, PSA and radiographic characteristics between TLW
                                                               “responders” and “progressors.” Numbers are presented as
            PSA at C1 (ug/L)                     91 (41.3–380)
                                                               absolute counts (percentages) or as medians (interquartile
            Haemoglobin (NR: 130–180 g/L)        122 (112–131)  range)
            Alkaline Phosphatase (NR: 30–100 U/L)  124 (83–359)
                                                               Characteristic   TLW responders   TLW progressors
            Albumin (NR: 36–52 g/L)               40 (36–42)                        (n=9)           (n=28)
            De novo metastatic disease             19 (51)     Baseline PSMA PET/CT
            Gleason score                                       TTV               125 (0.6–567)  48.7 (0.9–1002.7)
             ≤7                                    7 (19)
                                                                SUVmax            37.8 (5–122)    20.4 (5.6–122.3)
             8–10                                  21 (57)
                                                                SUVmean           8.5 (3.9–12)    6.6 (3.7–22.6)
             Unknown/Not available*                9 (24)      Post-treatment PSMA PET/CT
            Prior systemic treatments                           TTV               39 (0.6–116)    103 (2.4–2308)
             LHRH agonist/antagonist               37 (100)
                                                                SUVmax            7.8 (1.6–12.5)   16 (6.2–73.1)
             Chemotherapy                          37 (100)
                                                                SUVmean           3.7 (0.9–5.4)   4.8 (3.6–10.4)
             Docetaxel                             37 (100)    PSA progression*    1/9 (11)        19/28 (68)
             Cabazitaxel                           34 (92)     Radiographic         0/9 (0)         6/28 (21)
            ASI                                    37 (100)    progression*
            Note: * Indicates these participants had the diagnosis confirmed   Note: * Indicates at time of post-treatment imaging.
            by biopsy of a metastatic deposit or disease confirmation using   Abbreviations: PSA: Prostate-specific antigen; PSMA PET/CT: Prostate-specific
            biochemical (PSA) and imaging findings.            membrane  antigen-positron  emission  tomography/computed
            Abbreviations: ASI: Androgen-signaling inhibitor; ECOG: Eastern   tomography; SUV max: Maximum standardized uptake value; SUV mean: Mean
            cooperative oncology group; LHRH: Luteinising hormone releasing   standardized uptake value; TLW: Traffic light workflow; TTV: Total tumor
            hormone; NR: Normal range; PSA: Prostate-specific antigen.  volume.


            Volume 3 Issue 3 (2025)                         46                         doi: 10.36922/ARNM025110011

