


Page 56 - ARNM-3-3
P. 56
Advances in Radiotherapy
            & Nuclear Medicine                                                 LuPSMA response patterns on PSMA PET


                        A


                        B


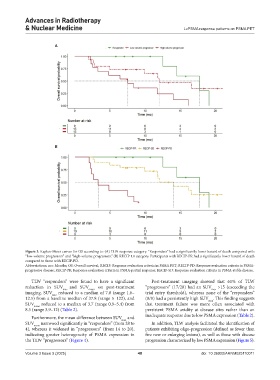
            Figure 3. Kaplan-Meier curves for OS according to: (A) TLW response category. “Responders” had a significantly lower hazard of death compared with
            “low-volume progressors” and “high-volume progressors.” (B) RECIP 1.0 category. Participants with RECIP-PR had a significantly lower hazard of death
            compared to those with RECIP-PD.
            Abbreviations: mo: Months; OS: Overall survival; RECIP: Response evaluation criteria in PSMA PET; RECIP-PD: Response evaluation criteria in PSMA-
            progressive disease; RECIP-PR: Response evaluation criteria in PSMA-partial response; RECIP-SD: Response evaluation criteria in PSMA-stable disease.

              TLW “responders” were found to have a significant   Post-treatment imaging showed that 61% of TLW
            reduction in SUV max   and SUV mean  on post-treatment   “progressors” (17/28) had an SUV  >15 (exceeding the
                                                                                           max
            imaging. SUV  reduced to a median of 7.8 (range 1.6–  trial entry threshold), whereas none of the “responders”
                       max
            12.5) from a baseline median of 37.8 (range 5–122), and   (0/9) had a persistently high SUV . This finding suggests
                                                                                          max
            SUV mean  reduced to a median of 3.7 (range 0.9–5.4) from   that treatment failure was more often associated with
            8.5 (range 3.9–12) (Table 2).                      persistent PSMA avidity at disease sites rather than an
              Furthermore, the mean difference between SUV  and   inadequate response due to low PSMA expression (Table 2).
                                                     max
            SUV mean  narrowed significantly in “responders” (from 28 to   In addition, TLW analysis facilitated the identification of
            4), whereas it widened in “progressors” (from 14 to 20),   patients exhibiting oligo-progression (defined as fewer than
            indicating greater heterogeneity of PSMA expression in   five new or enlarging lesions), as well as those with disease
            the TLW “progressors” (Figure 4).                  progression characterized by low PSMA expression (Figure 5).

            Volume 3 Issue 3 (2025)                         48                         doi: 10.36922/ARNM025110011

