
Page 58 - DP-2-1
P. 58
Design+ Importance of material selection
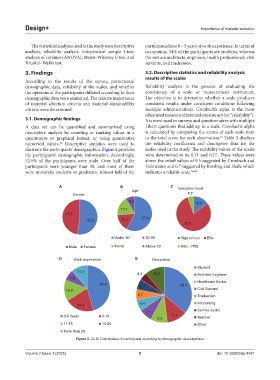
The statistical analyses used in the study were descriptive participants have 0 – 5 years of work experience. In terms of
analysis, reliability analysis, independent sample t-test, occupation, 34% of the participants are students, whereas
analysis of variance (ANOVA), Mann–Whitney U test, and the rest are architects, engineers, health professionals, civil
Kruskal–Wallis test. servants, and tradesmen.
3. Findings 3.2. Descriptive statistics and reliability analysis
results of the scales
According to the results of the survey, participants’
demographic data, reliability of the scales, and whether Reliability analysis is the process of evaluating the
the opinions of the participants differed according to their consistency of a scale or measurement instrument.
demographic data were examined. The relative importance The objective is to determine whether a scale produces
of material selection criteria and material sustainability consistent results under consistent conditions following
criteria were determined. multiple administrations. Cronbach’s alpha is the most
often used measure of internal consistency (or “reliability”).
3.1. Demographic findings It is most used in surveys and questionnaires with multiple
A data set can be quantified and summarized using Likert questions that add up to a scale. Cronbach’s alpha
descriptive analysis by counting or ranking values in a is calculated by comparing the scores of each scale item
quantitative or graphical format, or using quantitative to the total score for each observation. Table 3 displays
53
numerical values. Descriptive statistics were used to the reliability coefficients and descriptive data for the
52
illustrate the participants’ demographics. Figure 2 provides scales used in the study. The reliability values of the scales
the participants’ demographic information. Accordingly, were determined to be 0.71 and 0.77. These values were
52.5% of the participants were male. Over half of the above the cutoff values of 0.5 suggested by Cronbach and
participants were younger than 30, and most of them Helmstater and 0.7 suggested by Bowling and Shah, which
were university students or graduates. Almost half of the indicates a reliable scale. 54-56
A B C Education level
Age
Gender 5.7
8.5 14.9
17.7
47.5
52.5 16.3 57.4
79.4
Under 30 30-39 High school BSc
Male Female 40-49 Above 50 MSc - PhD
D Work experience E Occupation
Student
11.3 4.3 10.6 Architect Engineer
7.8
45.4 5.7 34.0 Healthcare Sector
14.9 Civil Servant
5.7 Tradesmen
20.6 6.4 Accounting
7.1 Service sector
0-5 Years 6-10 9.2 11.4 Teacher
11-15 16-20 Other
More than 20
Figure 2. (A-E) Distribution of participants according to demographic characteristics
Volume 2 Issue 1 (2025) 5 doi: 10.36922/dp.4491