
Page 61 - DP-2-1
P. 61
Design+ Importance of material selection
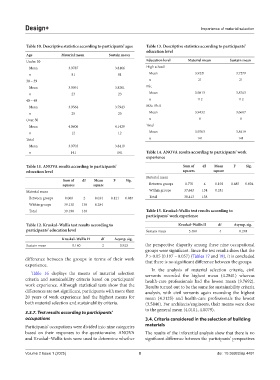
Table 10. Descriptive statistics according to participants’ ages Table 13. Descriptive statistics according to participants’
education level
Age Material mean Sustain mean
Under 30 Education level Material mean Sustain mean
Mean 3.9787 3.8166 High school
n 81 81 Mean 3.9221 3.7279
30 – 39 n 21 21
Mean 3.9091 3.8261 BSc
n 23 23 Mean 3.9813 3.8763
40 – 49 n 112 112
Mean 3.9564 3.7943 MSc-PhD
n 25 25 Mean 3.9432 3.6607
Over 50 n 8 8
Mean 4.0606 4.1429 Total
n 12 12 Mean 3.9703 3.8419
Total n 141 141
Mean 3.9703 3.8419
n 141 141 Table 14. ANOVA results according to participants’ work
experience
Table 11. ANOVA results according to participants’ Sum of df Mean F Sig.
education level squares square
Material mean
Sum of df Mean F Sig.
squares square Between groups 0.770 4 0.192 0.685 0.604
Material mean Within groups 37.643 134 0.281
Between groups 0.068 2 0.034 0.121 0.887 Total 38.413 138
Within groups 39.130 138 0.284
Total 39.198 140 Table 15. Kruskal–Wallis test results according to
participants’ work experience
Table 12. Kruskal–Wallis test results according to Kruskal–Wallis H df Asymp. sig.
participants’ education level Sustain mean 5.480 4 0.241
Kruskal–Wallis H df Asymp. sig.
Sustain mean 0.160 2 0.923 the perspective disparity among these nine occupational
groups were significant. Since the test results show that the
P > 0.05 (0.197 – 0.057) (Tables 17 and 18), it is concluded
difference between the groups in terms of their work that there is no significant difference between the groups.
experience.
In the analysis of material selection criteria, civil
Table 16 displays the means of material selection servants recorded the highest mean (4.2841) whereas
criteria and sustainability criteria based on participants’ health-care professionals had the lowest mean (3.7692).
work experience. Although statistical tests show that the Results turned out to be the same for sustainability criteria
differences are not significant, participants with more than analysis, with civil servants again recording the highest
20 years of work experience had the highest means for mean (4.3125) and health-care professionals the lowest
both material selection and sustainability criteria. (3.5846). For architects/engineers, their means were close
to the general mean (4.0101, 4.0079).
3.3.7. Test results according to participants’
occupations 3.4. Criteria considered in the selection of building
Participants’ occupations were divided into nine categories materials
based on their responses to the questionnaire. ANOVA The results of the inferential analysis show that there is no
and Kruskal–Wallis tests were used to determine whether significant difference between the participants’ perspectives
Volume 2 Issue 1 (2025) 8 doi: 10.36922/dp.4491