
Page 60 - DP-2-1
P. 60
Design+ Importance of material selection
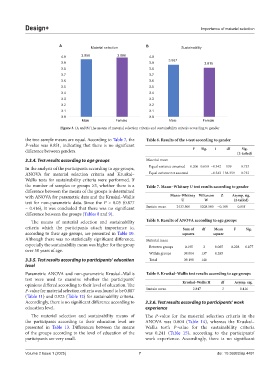
A Material selection B Sustainability
4.0 3.956 3.986 4.0
3.9 3.9 3.867 3.815
3.8 3.8
3.7 3.7
3.6 3.6
3.5 3.5
3.4 3.4
3.3 3.3
3.2 3.2
3.1 3.1
3.0 3.0
Male Female Male Female
Figure 3. (A and B) The means of material selection criteria and sustainability criteria according to gender
the two sample means are equal. According to Table 7, the Table 6. Results of the t‑test according to gender
P-value was 0.851, indicating that there is no significant
difference between genders. F Sig. t df Sig.
(2‑tailed)
3.3.4. Test results according to age groups Material mean
In the analysis of the participants according to age groups, Equal variance assumed 0.206 0.650 −0.342 139 0.733
ANOVA for material selection criteria and Kruskal– Equal variance not assumed −0.343 138.359 0.732
Wallis tests for sustainability criteria were performed. If
the number of samples or groups ≥3, whether there is a Table 7. Mann–Whitney U test results according to gender
difference between the means of the groups is determined
with ANOVA for parametric data and the Kruskal–Wallis Mann–Whitney Wilcoxon Z Asymp. sig.
test for non-parametric data. Since the P > 0.05 (0.877 U W (2‑tailed)
– 0.416), it was concluded that there was no significant Sustain mean 2433.500 5208.500 −0.188 0.851
difference between the groups (Tables 8 and 9).
The means of material selection and sustainability Table 8. Results of ANOVA according to age groups
criteria which the participants attach importance to, Sum of df Mean F Sig.
according to their age groups, are presented in Table 10. squares square
Although there was no statistically significant difference, Material mean
especially the sustainability mean was higher for the group Between groups 0.195 3 0.065 0.228 0.877
over 50 years of age.
Within groups 39.004 137 0.285
3.3.5. Test results according to participants’ education Total 39.198 140
level
Parametric ANOVA and non-parametric Kruskal–Wallis Table 9. Kruskal–Wallis test results according to age groups
test were used to examine whether the participants’ Kruskal–Wallis H df Asymp. sig.
opinions differed according to their level of education. The
P-value for material selection criteria was found to be 0.887 Sustain mean 2.847 3 0.416
(Table 11) and 0.923 (Table 12) for sustainability criteria.
Accordingly, there is no significant difference according to 3.3.6. Test results according to participants’ work
education level. experience
The material selection and sustainability means of The P-value for the material selection criteria in the
the participants according to their education level are ANOVA was 0.604 (Table 14), whereas the Kruskal–
presented in Table 13. Differences between the means Wallis test’s P-value for the sustainability criteria
of the groups according to the level of education of the was 0.241 (Table 15), according to the participants’
participants are very small. work experience. Accordingly, there is no significant
Volume 2 Issue 1 (2025) 7 doi: 10.36922/dp.4491