
Page 48 - DP-2-2
P. 48
Design+ EV charging capacity through queuing model
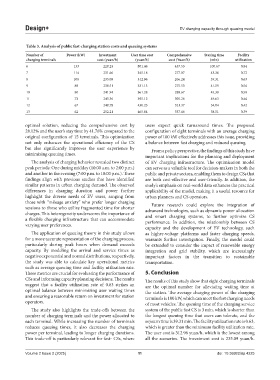
Table 3. Analysis of public fast‑charging station costs and queuing systems
Number of Power (kW) Investment User time cost Comprehensive Staying time Facility
charging terminals cost (yuan/h) (yuan/h) cost (Yuan/h) (min) utilization
6 133 228.23 801.46 457.53 100.67 0.84
7 114 231.66 345.18 277.07 43.36 0.72
8 100 235.09 312.96 266.24 39.31 0.63
9 89 238.51 331.13 275.53 41.59 0.56
10 80 241.94 361.28 289.67 45.38 0.50
11 73 245.36 395.12 305.26 49.63 0.46
12 67 248.78 430.25 321.37 54.04 0.42
13 62 252.21 465.84 337.66 58.51 0.39
optimal solution, reducing the comprehensive cost by users expect quick turnaround times. The proposed
28.12% and the user’s stay time by 41.76% compared to the configuration of eight terminals with an average charging
original configuration of 15 terminals. This optimization power of 100 kW effectively addresses this issue, providing
not only enhances the operational efficiency of the CS a balance between fast charging and reduced queuing.
but also significantly improves the user experience by From a policy perspective, the findings of this study have
minimizing queuing times.
important implications for the planning and deployment
The analysis of charging behavior revealed two distinct of EV charging infrastructure. The optimization model
peak periods: One during midday (10:00 a.m. to 2:00 p.m.) can serve as a valuable tool for decision-makers in both the
and another in the evening (7:00 p.m. to 10:00 p.m.). These public and private sectors, enabling them to design CSs that
findings align with previous studies that have identified are both cost-effective and user-friendly. In addition, the
similar patterns in urban charging demand. The observed study’s emphasis on real-world data enhances the practical
differences in charging duration and power further applicability of the model, making it a useful resource for
highlight the diverse needs of EV users, ranging from urban planners and CS operators.
those with “mileage anxiety” who prefer longer charging Future research could explore the integration of
sessions to those who utilize fragmented time for shorter advanced technologies, such as dynamic power allocation
charges. This heterogeneity underscores the importance of and smart charging systems, to further optimize CS
a flexible charging infrastructure that can accommodate performance. In addition, the relationship between CS
varying user preferences.
capacity and the development of EV technology, such
The application of queuing theory in this study allows as higher-voltage platforms and faster charging speeds,
for a more accurate representation of the charging process, warrants further investigation. Finally, the model could
particularly during peak hours when demand exceeds be extended to consider the impact of renewable energy
capacity. By modeling the arrival and service times as integration and grid stability, which are increasingly
negative exponential and normal distributions, respectively, important factors in the transition to sustainable
the study was able to calculate key operational metrics transportation.
such as average queuing time and facility utilization rate.
These metrics are crucial for evaluating the performance of 5. Conclusion
CSs and informing capacity planning decisions. The results The results of this study show that eight charging terminals
suggest that a facility utilization rate of 0.63 strikes an are the optimal number for alleviating waiting time at
optimal balance between minimizing user waiting times the station. The average charging power of the charging
and ensuring a reasonable return on investment for station terminals is 100 kW, which can meet the fast charging needs
operators. of most vehicles. The queuing time of the charging service
The study also highlights the trade-offs between the system of the public fast CS is 3 min, which is shorter than
number of charging terminals and the power allocated to the longest queuing time that users can tolerate, and the
each terminal. While increasing the number of terminals sojourn time is 39.31 min. The facility utilization rate is 0.63,
reduces queuing times, it also decreases the charging which is greater than the minimum facility utilization rate.
power per terminal, leading to longer charging durations. The user cost is 312.96 yuan/h, which is the lowest among
This trade-off is particularly relevant for fast- CSs, where all the scenarios. The investment cost is 235.09 yuan/h.
Volume 2 Issue 2 (2025) 11 doi: 10.36922/dp.4225