
Page 44 - DP-2-2
P. 44
Design+ EV charging capacity through queuing model
charging terminals to realize the satisfaction of charging investment cost and the user’s time cost, respectively; γ +
1
demand through the flexible distribution of power, as γ = 1. The description of each cost and its components are
1
shown in Figure 7. Therefore, CS can freely choose how as follows.
many charging terminals to configure according to the The investment cost of a public fast CS k is the
actual situation. For a fixed-capacity integrated charging cost of building and operating the CS. The investment
box transformer, if a large number of charging terminals costs include the following. Charging equipment costs,
are connected, when all terminals are charged at the same including the purchase and installation of high-low voltage
time, the average charging power obtained by each terminal integrated charging box-type transformers and several
will be relatively low. On the contrary, if the number of charging terminals. Station land costs, including the cost
connected charging terminals is small, the charging power of charging spaces, queuing areas, and user lounges. The
obtained by each terminal will be relatively high. station construction costs encompass the purchase and
The number of charging terminals and charging power installation of charging equipment, lighting systems,
are the key optimization elements in the CS optimization monitoring systems, and smart access control gates, as
model. To minimize the sum of the investment cost of the well as the construction expenses for user waiting lounges.
CS and the cost of the user’s waiting time, we established Station operation cost, the distribution cost of all electric
a CS capacity optimization model. In this model, we facilities in the station, and the labor cost required for daily
converted the cost into cost per unit time and incorporated inspection and maintenance. The investment cost can be
it into the objective function, and the optimization goal expressed by Equations IX and X.
was to minimize the integrated social cost of each CS, as + +c + c c c
in Equation VIII. d (1 + )d r xb pd td js
F = 365 ×24
F
min k = γ F 1 ik + γ F 2 tk (VIII) ik + (1 d r − ) 1 c zd + c wh × s + (IX)
×24 365
In Equation VIII, F denotes the integrated social
k
cost per unit time of public fast-CS k, which is the sum P xb α
of investment cost and user time cost. F is the cost of c pd = β (X)
ik
spreading the investment cost of public fast-CS k into unit
time. F is the time cost of users per unit time in public In the formula, r is the operating years of the station; d is the
ik
fast-CS k. γ and γ denote the weighting coefficients of current discount rate; c is the price of the high-low voltage
2
xb
1
the two optimization objectives of the public fast-CS’s integrated box-type transformer; c is the distribution cost
pd
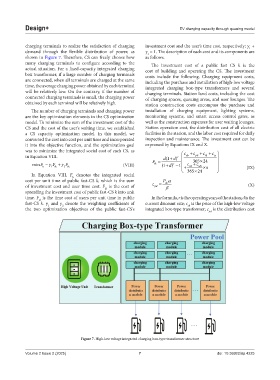
Figure 7. High-low voltage integrated charging box-type transformer structure
Volume 2 Issue 2 (2025) 7 doi: 10.36922/dp.4225