
Page 43 - DP-2-2
P. 43
Design+ EV charging capacity through queuing model
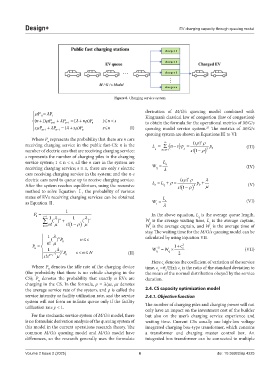
Figure 6. Charging service system
µ = P derivation of M/G/s queuing model combined with
λ P
0 1 Kingman’s classical law of congestion (law of congestion)
µ+ (n n + λ + 1) P n −1 1 ( λ = P n µ + )P n 1 < ns to obtain the formula for the operational metrics of M/G/s
µ sP + λ + ( λ = P s µ + )P s n (I) queuing model service system. The metrics of M/G/s
25
n
1
n
n
−1
queuing system are shown in Equations III to VI:
Where P represents the probability that there are n cars
n
)
receiving charging service in the public fast-CS; n is the = L ∑ ∞ ( − n sp = (s ρρ) s p (III)
( −
=
number of electric cars that are receiving charging service; q ns +1 n s ! 1 ) ρ 2 0
s represents the number of charging piles in the charging
service system; 1 ≤ n < s, all the n cars in the system are L q
receiving charging service; s ≤ n, there are only s electric W q = λ (IV)
cars receiving charging service in the system; and the n-s
)
s
electric cars need to queue up to receive charging service. (s ρ ρ λ
After the system reaches equilibrium, using the recursive s =L q +L ρ = s !1 ) ρ 2 0 +p µ (V)
( −
method to solve Equation Ⅰ, the probability of various
states of EVs receiving charging services can be obtained L
s
as Equation Ⅱ. W s = λ (VI)
1
P = In the above equation, L is the average queue length,
0 s −1 1 1 q
∑ () + () W is the average waiting time, L is the average captain,
λ s
λ n
s
q
( −
n =0 ! n µ s !1 ρ ) µ W is the average captain, and W is the average time of
s
s
stay. The waiting time for the M/G/s queuing model can be
1 λ n calculated by using Equation VII.
≤
! () P 0 ns
n
µ
P n = G 1c 2 s
+
1 () P sn (II) W q =W q × 2 (VII)
<≤ N
λ s
! ss ns µ 0
−
Here c denotes the coefficient of variation of the service
s
Where P denotes the idle rate of the charging device time, c =σ /E(x); c is the ratio of the standard deviation to
0
s
s
s
(the probability that there is no vehicle charging in the the mean of the normal distribution obeyed by the service
CS); P denotes the probability that exactly n EVs are duration.
n
charging in the CS. In the formula, ρ = λ/μs, μs denotes
the average service rate of the system, and ρ is called the 2.4. CS capacity optimization model
service intensity or facility utilization rate, and the service 2.4.1. Objective function
system will not form an infinite queue only if the facility The number of charging piles and charging power will not
utilization rate ρ < 1.
only have an impact on the investment cost of the builder
For the stochastic service system of M/G/s model, there but also on the user’s charging service experience and
is no formulaic derivation analysis of the queuing system of waiting time. Current CSs usually use high-low voltage
this model in the current operations research theory. The integrated charging box-type transformer, which contains
common M/G/s queuing model and M/G/s model have a transformer and charging master control box. An
differences, so the research generally uses the formulaic integrated box transformer can be connected to multiple
Volume 2 Issue 2 (2025) 6 doi: 10.36922/dp.4225