
Page 41 - DP-2-2
P. 41
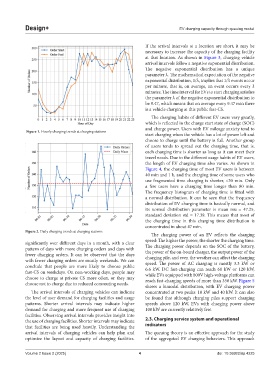
Design+                                                          EV charging capacity through queuing model


                                                               If the arrival intervals at a location are short, it may be
                                                               necessary to increase the capacity of the charging facility
                                                               at that location. As shown in  Figure  3, charging vehicle
                                                               arrival intervals follow a negative exponential distribution.
                                                               The negative exponential distribution has a unique
                                                               parameter λ. The mathematical expectation of the negative
                                                               exponential distribution, 1/λ, implies that 1/λ events occur
                                                               per minute, that is, on average, an event occurs every λ
                                                               minutes. The time interval for EVs to start charging satisfies
                                                               the parameter λ of the negative exponential distribution to
                                                               be 9.47, which means that on average every 9.47 min there
                                                               is a vehicle charging at this public fast-CS.
                                                                 The charging habits of different EV users vary greatly,
                                                               which is reflected in the charge start state of charge (SOC)
                                                               and charge power. Users with EV mileage anxiety tend to
            Figure 1. Hourly charging trends at charging stations
                                                               start charging when the vehicle has a lot of power left and
                                                               choose to charge until the battery is full. Another group
                                                               of users tends to spread out the charging time, that is,
                                                               each charging time is shorter as long as it can meet their
                                                               travel needs. Due to the different usage habits of EV users,
                                                               the length of EV charging time also varies. As shown in
                                                               Figure 4, the charging time of most EV users is between
                                                               40 min and 1 h, and the charging time of some users who
                                                               use fragmented time charging is shorter, <30 min. Only
                                                               a few users have a charging time longer than 80  min.
                                                               The  frequency histogram of  charging time is  fitted  with
                                                               a normal distribution. It can be seen that the frequency
                                                               distribution of EV charging time is basically normal, and
                                                               its normal distribution parameter is mean mu = 47.25,
                                                               standard deviation std = 17.39. This means that most of
                                                               the charging time in this charging time distribution is
                                                               concentrated in about 47 min.
            Figure 2. Daily charging trends at charging stations
                                                                 The charging power of an EV reflects the charging
                                                               speed: The higher the power, the shorter the charging time.
            significantly over different days in a month, with a clear   The charging power depends on the SOC of the battery,
            pattern of days with more charging orders and days with
            fewer charging orders. It can be observed that the days   the power of the on-board charger, the output power of the
            with fewer charging orders are mostly weekends. We can   charging pile, and even the weather can affect the charging
                                                               speed. The power of AC charging is mostly 3.3 kW or
            conclude that people are more likely to choose public   6.6 kW. DC fast-charging can reach 60 kW or 120 kW,
            fast-CS on weekdays. On non-working days, people may   while EVs equipped with 800V high-voltage platforms can
            choose to charge at private CS more often, or they may   reach fast-charging speeds of more than 350 kW. Figure 5
            choose not to charge due to reduced commuting needs.
                                                               shows  a  bimodal  distribution,  with  EV  charging  power
              The arrival intervals of charging vehicles can indicate   concentrated at two peaks: 18 kW and 40 kW. It can also
            the level of user demand for charging facilities and usage   be found that although charging piles support charging
            patterns. Shorter arrival intervals may indicate higher   speeds above 120 kW, EVs with charging power above
            demand for charging and more frequent use of charging   100 kW are currently relatively few.
            facilities. Observing arrival intervals provides insight into
            the use of charging facilities. Shorter intervals may indicate   2.3. Charging service system and operational
            that facilities are being used heavily. Understanding the   indicators
            arrival intervals of charging vehicles can help plan and   The queuing theory is an effective approach for the study
            optimize the  layout and capacity of charging facilities.   of the aggregated EV charging behaviors. This approach


            Volume 2 Issue 2 (2025)                         4                                doi: 10.36922/dp.4225