
Page 92 - DP-2-2
P. 92
Design+ Closed-form solution for pressurized obround shells
stresses based on the tangential forces (Equations I and Radial stress was in tension through most of the
II) and bending moments (Equations XX and XXI) of thickness of section C but in compression across the entire
sections. thickness of section D (Figure 6). Radial stress in the shell
The hoop stress distribution was nonlinear in section C was much smaller than hoop stress.
and approximately linear in section D. As sections C and D were located far from section B, the
As there are no geometry and load boundary proposed expressions of stress distribution were expected
condition discontinuities from segments C to D, hoop to be accurate.
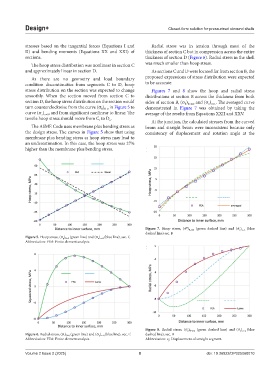
stress distribution on the section was expected to change Figures 7 and 8 show the hoop and radial stress
smoothly. When the section moved from section C to distributions at section B across the thickness from both
section D, the hoop stress distribution on the section would sides of section B, (σ ) and (σ ) . The averaged curve
θ θ=π/2
x x=L
turn counterclockwise from the curve (σ ) in Figure 5 to demonstrated in Figure 7 was obtained by taking the
θ θ=0
curve (σ ) , and from significant nonlinear to linear. The average of the results from Equations XXII and XXV.
x x=0
tensile hoop stress should move from C to D . At the junction, the calculated stresses from the curved
i
o
The ASME Code uses membrane plus bending stress as beam and straight beam were inconsistent because only
the design stress. The curves in Figure 5 show that using consistency of displacement and rotation angle at the
membrane plus bending stress as hoop stress may lead to
an underestimation. In this case, the hoop stress was 27%
higher than the membrane plus bending stress.
Figure 7. Hoop stress, (σ ) θ=π/2 (green dashed line) and (σ x ) x=L (blue
θ
dashed line) sec. B
Figure 5. Hoop stress, (σ ) θ=0 (green line) and (σ x ) x=0 (blue line), sec. C
θ
Abbreviation: FEA: Finite element analysis.
Figure 8. Radial stress, (σ r ) θ=π/2 (green dashed line) and (σ y ) x=L (blue
Figure 6. Radial stress, (σ r ) θ=0 (green line) and (σ y ) x=0 (blue line), sec. C dashed line), sec. B
Abbreviation: FEA: Finite element analysis. Abbreviation: v y : Displacement of straight segment.
Volume 2 Issue 2 (2025) 8 doi: 10.36922/DP025060010